HR Analysis
تفاصيل العمل
? Fourth Dashboard Project – HR Analysis
This is the final dashboard from the Excel Dashboard course (Part 2) in my Data Analysis Diploma with El-Araby E-learning.
The challenge here was to bring together HR and Finance data into a single, interactive view:
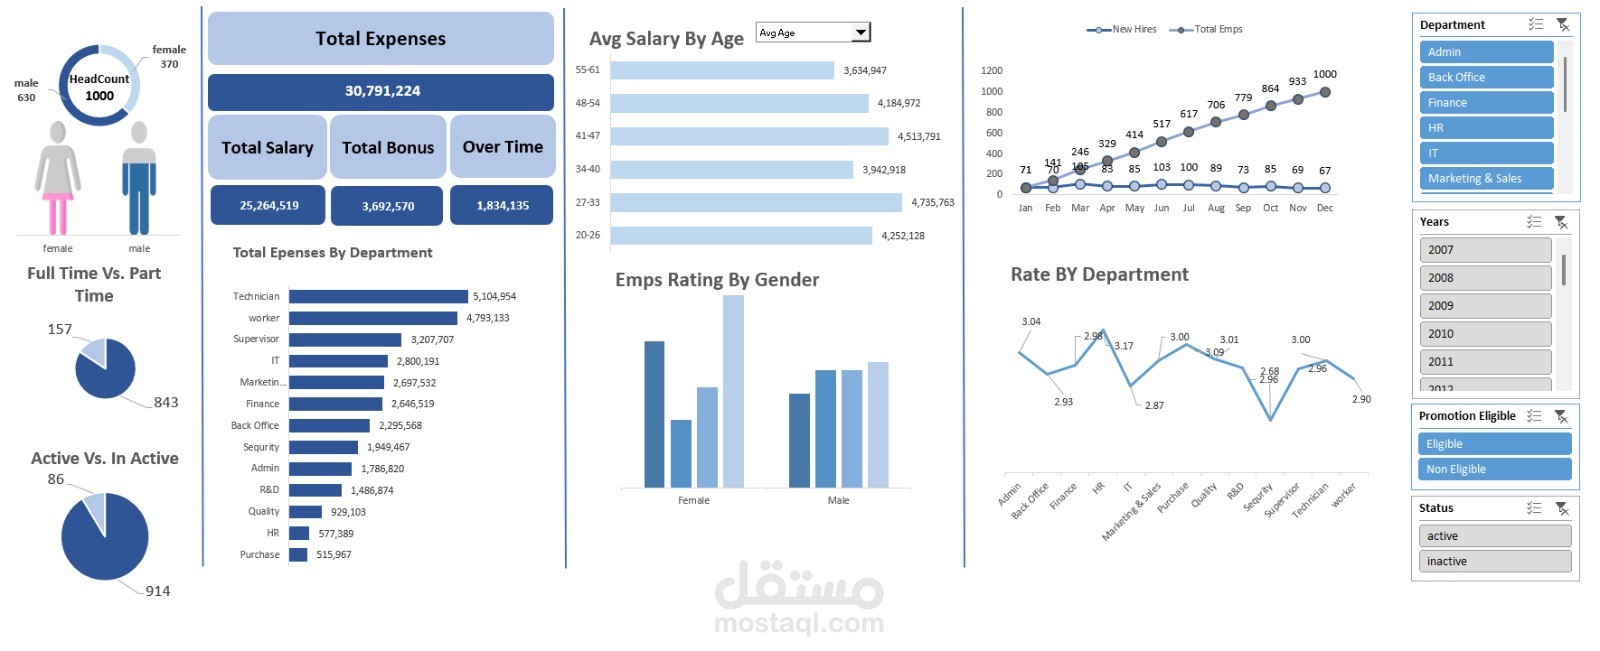
? KPI cards for Total Expenses split into Salary, Bonus, and Overtime.
? Employee breakdown by gender, contract type (full-time vs part-time), and activity status (active vs inactive).
? Expenses by Department with clear ranking.
? Average Salary comparison with a combo box to switch between By Age and By Experience.
? Department Headcount analysis and a performance rate chart to highlight areas needing improvement.
? Fully interactive navigation with slicers for department-level insights.
? The result: An HR Dashboard that provides management with a clear, actionable view of workforce distribution, costs, and performance — all in one place.