Supply Chain Performance & Order Fulfillment Dashboard
تفاصيل العمل
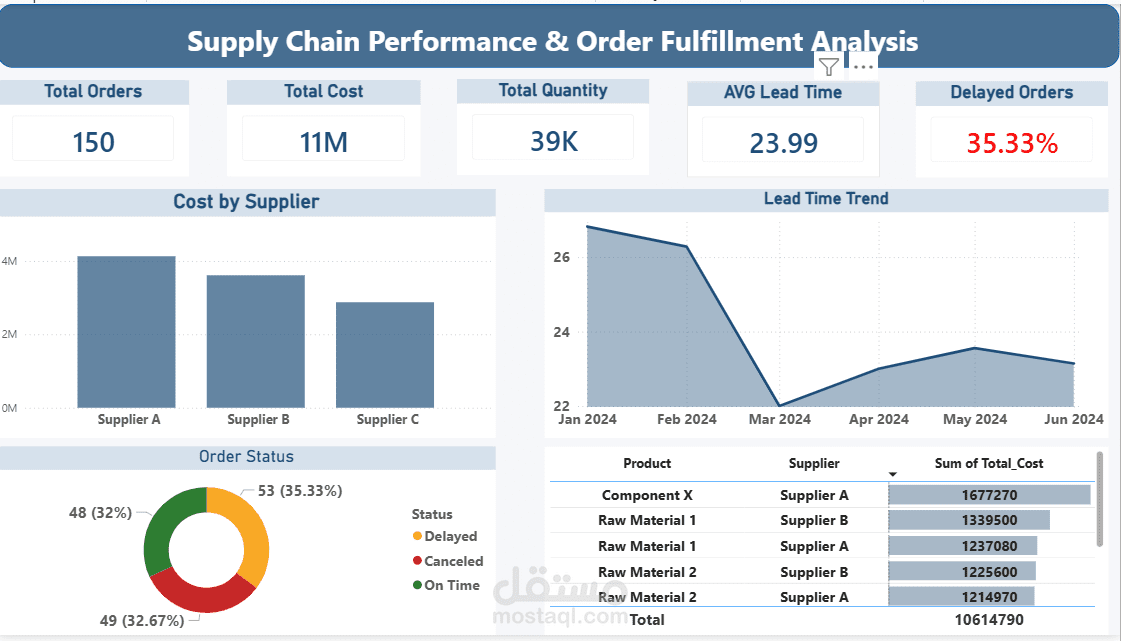
? Overview
This dashboard monitors supply chain efficiency, supplier costs, and order fulfillment.
? Key Insights
It tracks 150 orders, $11M in procurement costs, and 39K units, with an average lead time of 23.99 days. About 35.33% of orders are delayed, indicating supplier and operational issues. Supplier A is the highest cost contributor, while lead time trends reveal performance fluctuations.
? Business Value
Helps teams reduce delays, optimize suppliers, and improve supply chain efficiency.