Sales and Collection Analytics Dashboard
تفاصيل العمل
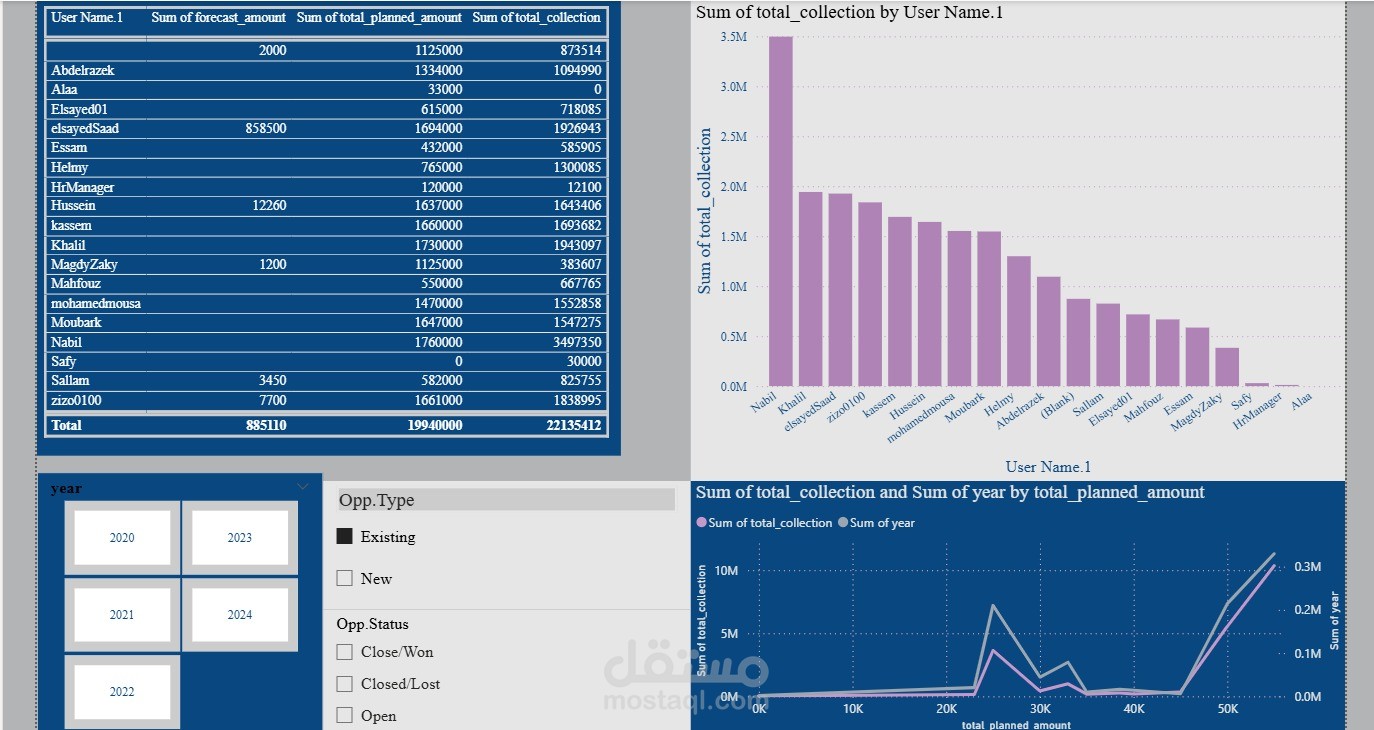

I built this interactive dashboard to help businesses track their sales and financial collections in one place. It turns complex data into simple visuals that show who is performing best and where the money is coming fromPerformance Tracking: A detailed table showing each team member's forecast vs. their actual collected amounts.
Top Achievers: A clear bar chart that ranks employees by their total collections (e.g., highlighting top performers like Nabil).
Easy Filters: You can quickly filter data by year (2020-2024), opportunity type, or status (Won, Lost, or Open).
Financial Trends: A line graph that compares planned amounts with actual collections to spot any gaps.