real data
تفاصيل العمل
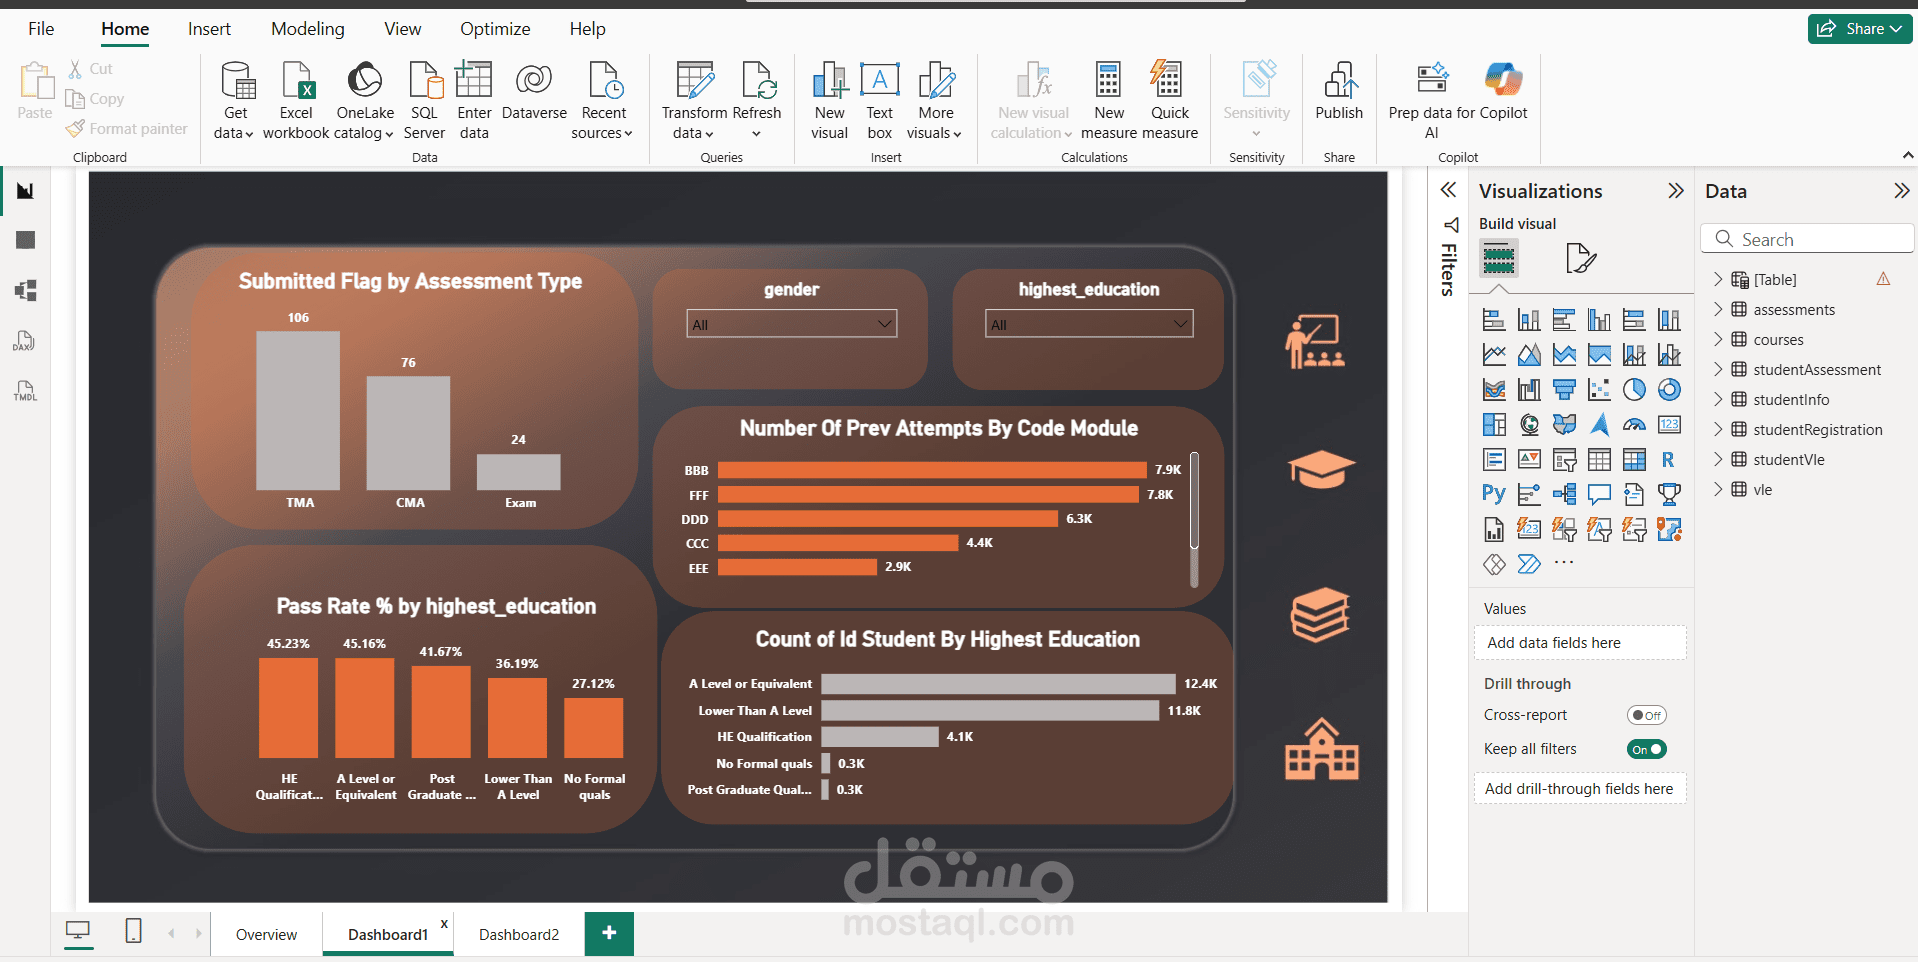
This interactive dashboard provides a comprehensive analysis of Open University Learning data, designed to help stakeholders understand student performance and demographics clearly.
Key insights included in the dashboard:
Final results analysis by age bands (Pass, Fail, Distinction, Withdrawn)
Distribution of students by gender
Total number of students with key KPIs:
Total Students
Passed Students
Failed Students
Withdrawn Students
Students distribution based on marital status
Overview of the number of modules
The dashboard is built using Power BI, with a clean and visually appealing design that makes complex data easy to interpret. It enables quick decision-making through clear metrics, comparisons, and interactive visuals.
This solution is ideal for educational institutions looking to monitor performance, analyze student behavior, and improve learning outcomes through data-driven insights.