GOVI Dashboard
تفاصيل العمل
تنويه هام: "هذه البيانات غير حقيقية هي فقط مجرد محاكاة لنظام وسيستم الشركة وليس لها اي صلة تماما ببيانات الشركة"
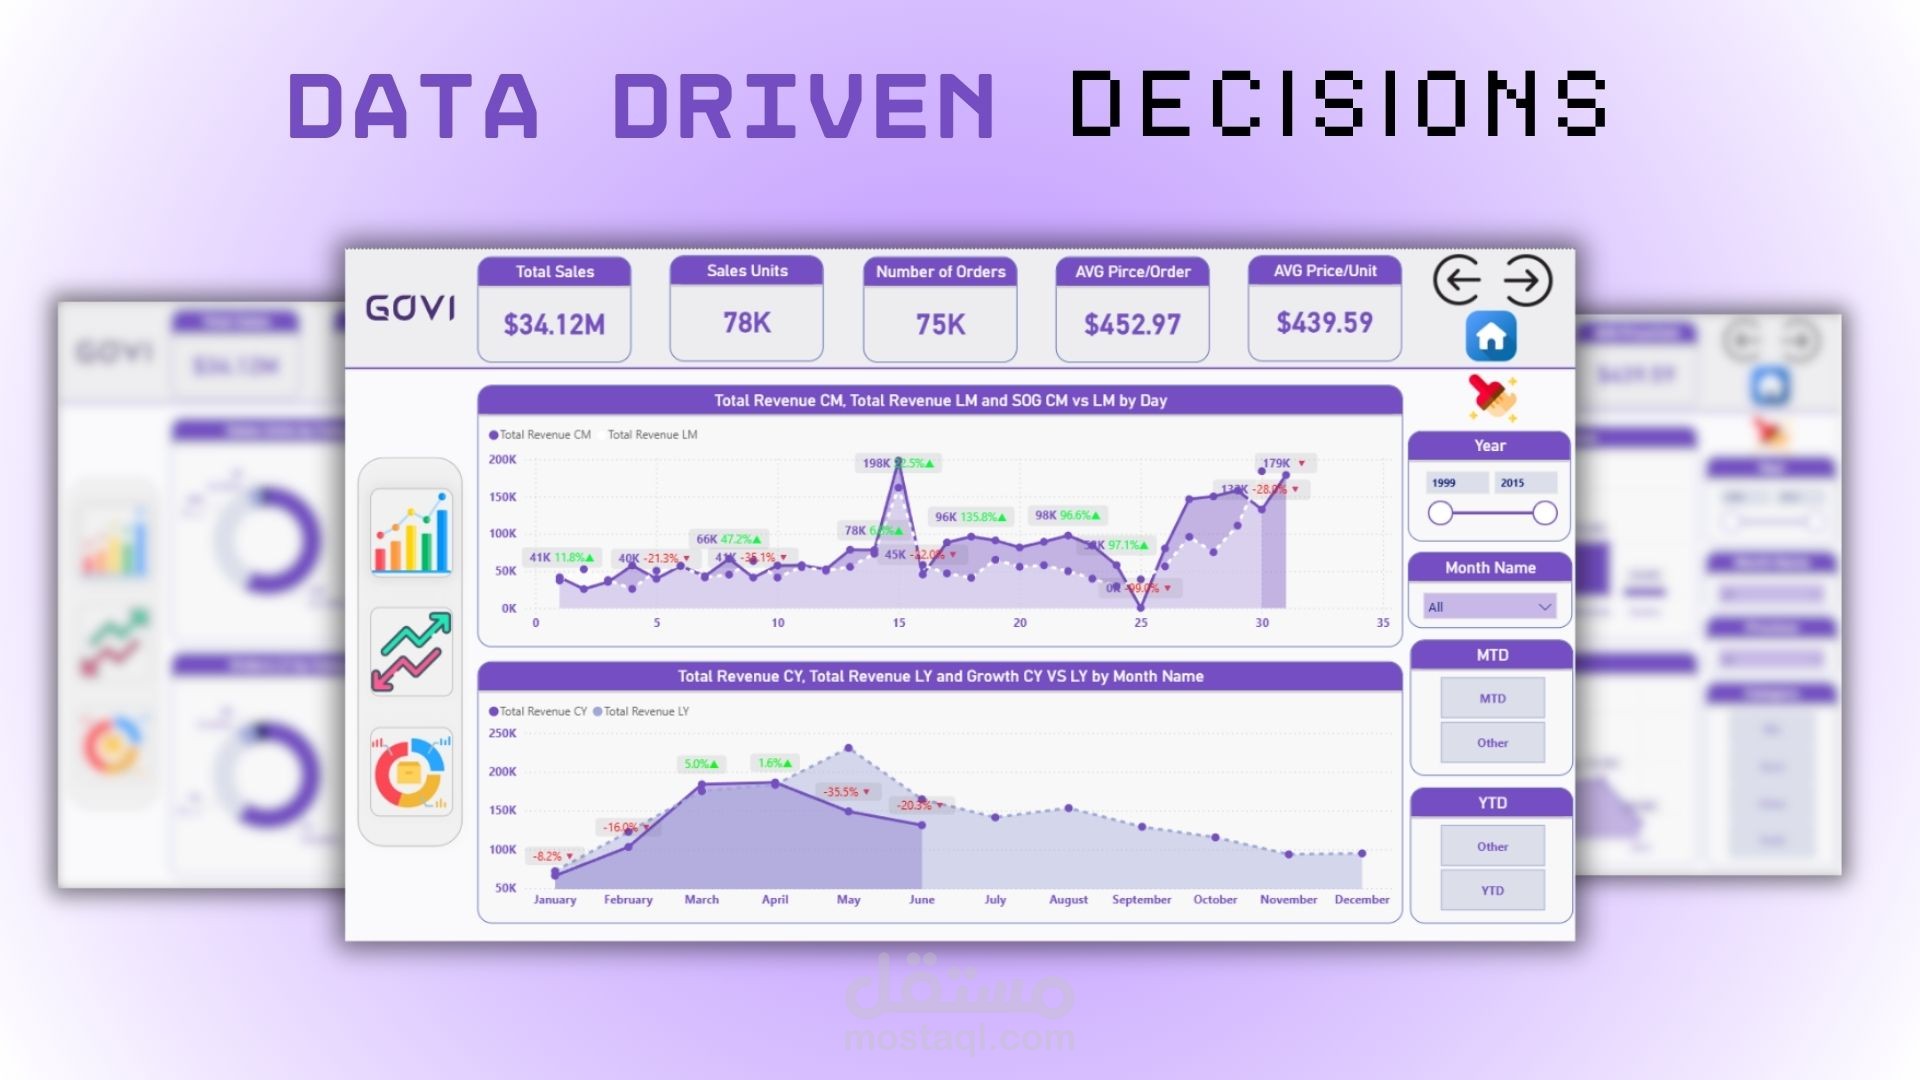
مبيعات بـ 34 مليون دولار في السوق الكندي! تعالوا نفكك طلاسم الداشبورد الشاملة دي ونشوف سر الأرقام
الداشبورد دي (اللي متكونة من 5 شاشات) عبارة عن تحفة فنية ممتازة، وخصوصاً إنها معمولة لتحليل مبيعات السوق الكندي (زي ما اللوجو CA Sales وورقة الـ Maple بيوضحوا). الشاشات دي بتغطي كل حاجة؛ من أول الأرباح لحد أداء الشركات المصنعة!
تعالوا نطلع بخلاصة الأرقام دي:
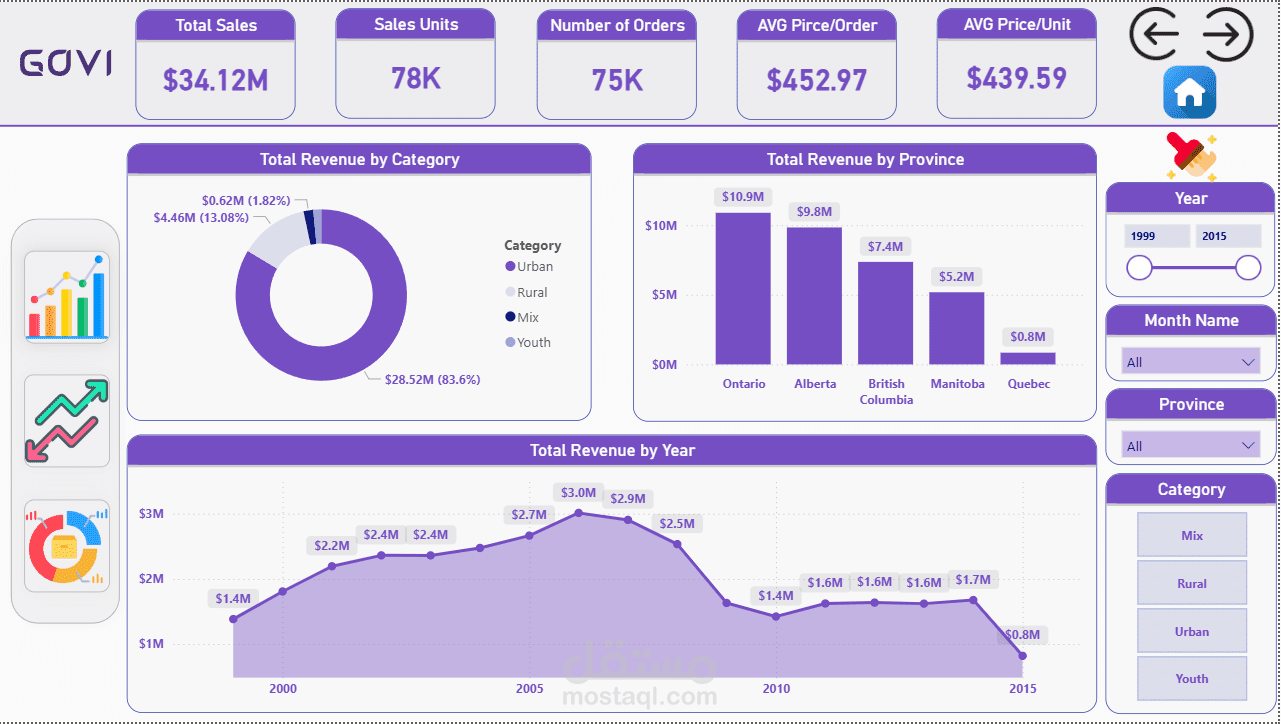
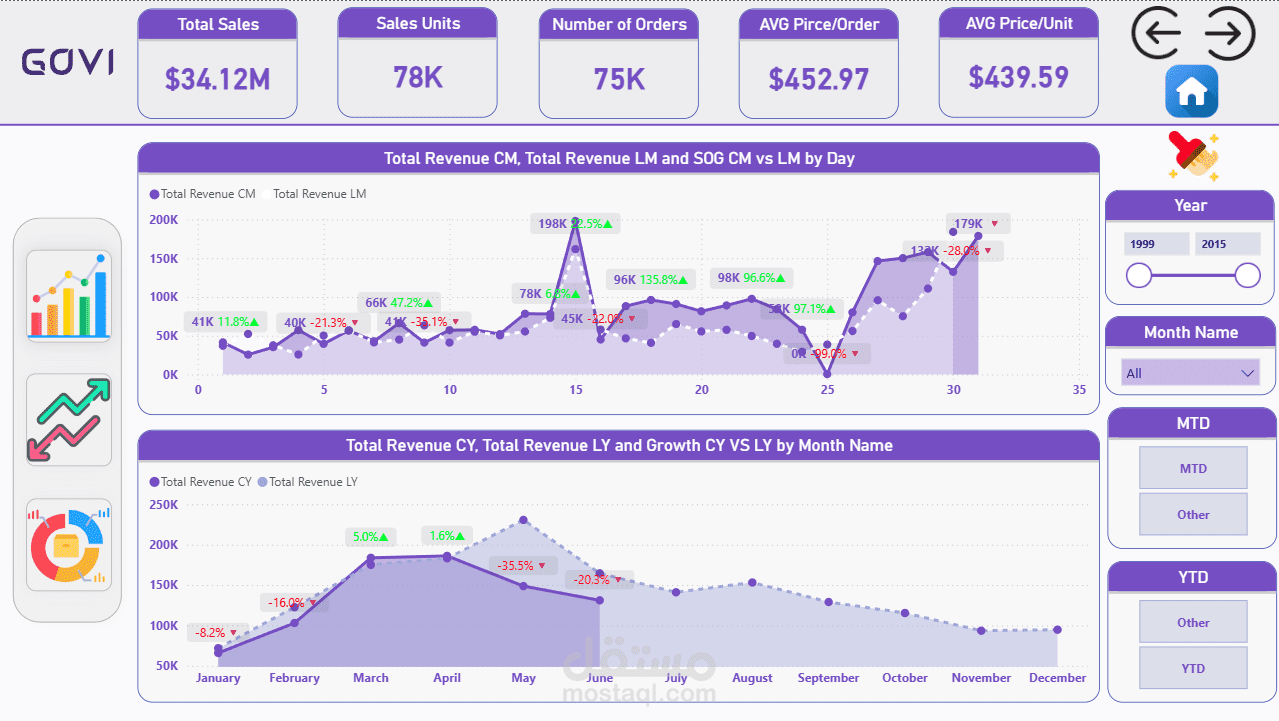
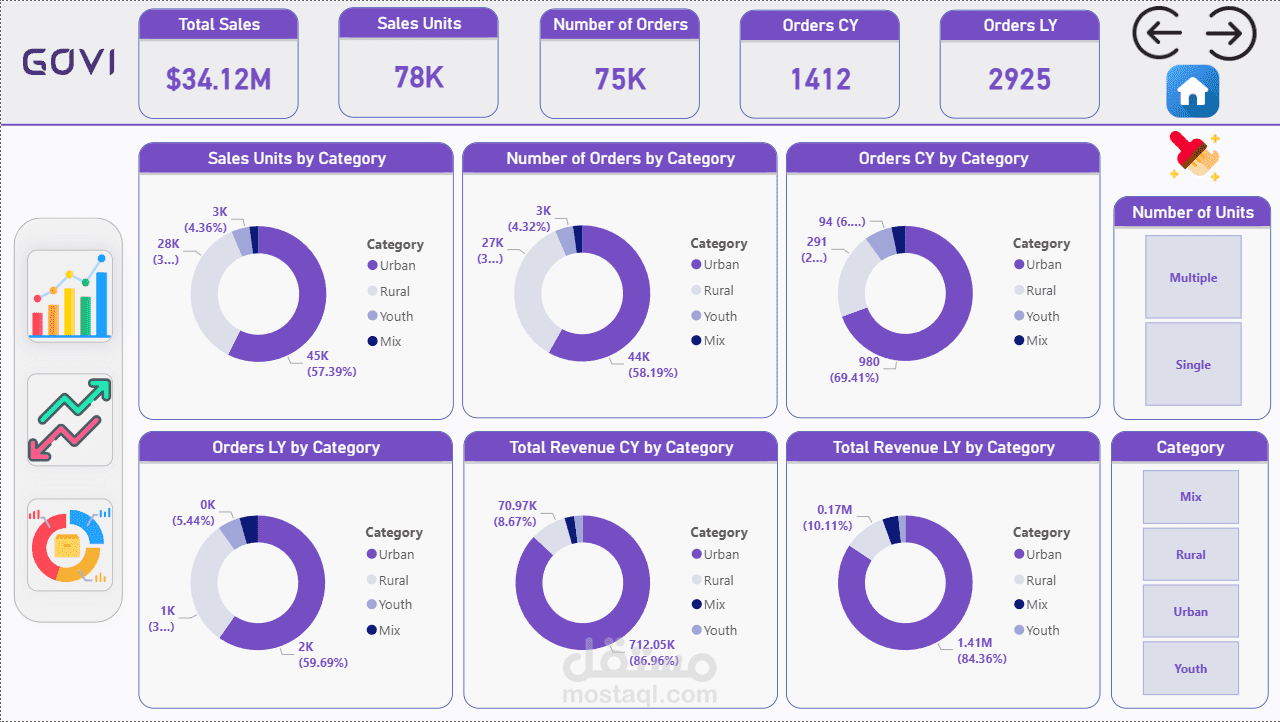
الصورة الكبيرة (الـ KPIs): الأرقام اللي فوق ثابتة ومريحة للعين، الشركة دي باعت بـ 34.1 مليون، وجمعت أكتر من 75 ألف أوردر.
خريطة الفلوس في كندا: في أول شاشة، الأعمدة الحمرا بتقولنا إن مقاطعة "أونتاريو" (Ontario) هي اللي شايلة المبيعات على كتافها بـ 10.9 مليون، ووراها "ألبرتا" (Alberta). يعني التركيز التسويقي كله مفروض يكون هناك.
لعبة المقارنات (CY vs LY): الشاشة التانية فيها حركة "حريفة" جداً بشغل الـ DAX في الـ Power BI! بتعمل مقارنة شهرية بين مبيعات السنة الحالية (CY) والسنة اللي فاتت (LY). الأخضر معناه إننا كسبانين ومعديين السنة اللي فاتت (زي شهر مارس وأبريل)، والأحمر معناه إننا متراجعين (زي شهر مايو اللي نزل بنسبة 35.5%-!).
الجمهور والمنتجات: في الشاشة التالتة والرابعة، واضح جداً إن فئة الـ "Urban" (المدن) هي اللي واكلة الجو ومستحوذة على أكتر من 83% من الأرباح. كمان بنقدر نشوف مين "حيتان" الموردين أو الشركات المصنعة، وشركة (VanArsdel) متصدرة المبيعات باكتساح في كل المقاييس.
الشرائح (Segments): الشاشة الأخيرة بتفلتر المبيعات حسب نوع الشريحة، وواضح إن الـ (Convenience) أو المنتجات الاستهلاكية المريحة هي اللي بتجيب أعلى فلوس (11.9 مليون).
Overview:
This robust, 5-page dashboard is a prime example. Tailored specifically for the Canadian market (indicated by the "CA Sales" logo), it offers a 360-degree view of a company's retail and distribution performance.
Here is the story the data tells us:
Top-Line Metrics: The header is clean and consistent across all pages, instantly showing a massive $34.1M in Total Revenue generated from 75.3K orders.
Geographic Dominance (Image 1): The provincial breakdown shows that Ontario ($10.9M) and Alberta ($9.8M) are the core revenue drivers for this business, severely outperforming regions like Quebec.
Time Intelligence & DAX Power (Image 2): This page is a technical flex. It compares Current Year (CY) vs Last Year (LY) metrics. The area chart highlights a strong growth period in March/April (green), followed by a concerning -35.5% drop in May (red). This is exactly what executives need to see for strategic pivots.
Market Categories (Image 3): The donut charts clearly indicate that the "Urban" category is the absolute cash cow, dominating with 83.6% of the total revenue.
Manufacturers & Segments (Images 4 & 5): The final pages drill down into specific suppliers and product segments. The manufacturer VanArsdel is the undisputed top performer across total revenue, CY orders, and sales units. Meanwhile, the "Convenience" segment drives the highest financial return.