Bike sales
تفاصيل العمل
Bike Sales Performance Analysis
Description:
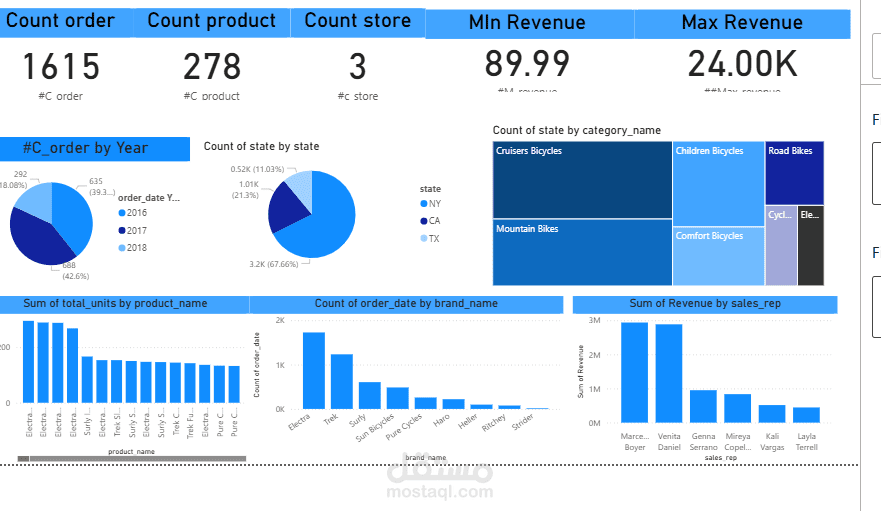
This project analyzes bike sales performance across three states (California, New York, and Texas) over multiple years and evaluates revenue contribution by sales representatives. The goal is to identify trends, top performers, and areas needing improvement to optimize sales strategy.
Analysis Overview:
Objective: Evaluate sales distribution across states, yearly growth trends, and individual sales representative performance.
Segmentation:
States: California (CA), New York (NY), Texas (TX)
Years: 2016, 2017, 2018
Sales Representatives: Classified by revenue performance (Good Revenue / Bad Revenue)
Metrics:
Sales distribution by state
Revenue growth per year
Revenue performance per salesperson
Key Findings:
State Distribution:
California (CA): 21% of total sales
New York (NY): 67% of total sales → major contributor
Texas (TX): 12% of total sales
Yearly Sales Growth:
2016 → 39%
2017 → 42%
2018 → 119% → significant growth, indicating strong market expansion
Sales Representative Performance:
Good Revenue Contributors:
Marcelene Boyer
Venita Daniel
Underperformers / Bad Revenue:
Kali Vargas
Layla Terrell
Insights:
New York is the strongest market, contributing the majority of sales.
Significant revenue spike in 2018 indicates effective sales strategies or market growth.
Identified top-performing sales representatives for recognition and underperformers for potential coaching.
Useful for decision-making in sales optimization, resource allocation, and incentive programs.
Skills Demonstrated:
Data Aggregation and Analysis
Trend Analysis Over Time
Comparative Analysis Across States and Sales Representatives
Revenue Performance Evaluation and Reporting
Outcome:
Highlighted key states and years for strategic focus
Recognized top-performing sales staff and identified improvement areas
Provided actionable insights to guide future sales strategy