تحليل دراسة (NHANES) حول السكري: الارتباط بين مؤشر كتلة الجسم والتشخيص NHANES Diabetes Analysis: The Link Between BMI and Diagnosis
تفاصيل العمل
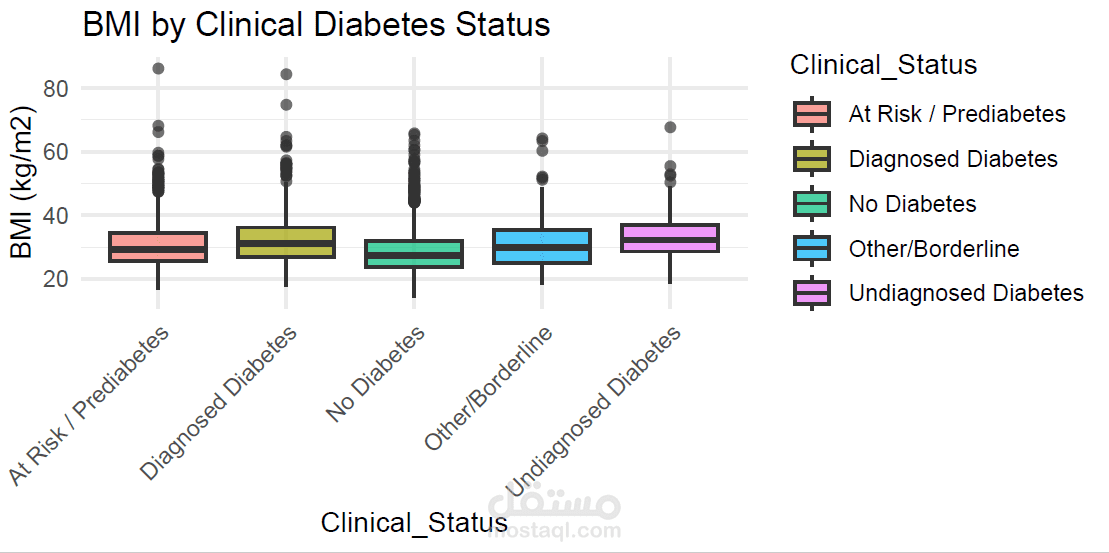
The analysis of 4,940 participants demonstrates a clear correlation between Body Mass Index (BMI) and clinical diabetes status:
Highest BMI in Undiagnosed Cases: Participants with Undiagnosed Diabetes had the highest average BMI at 34 kg/m².
Obesity Prevalence: Within the undiagnosed group, 67% of individuals fell into the Obese category.
Diagnosed vs. Healthy: Those with diagnosed diabetes had an average BMI of 32 kg/m², while the "No Diabetes" group had the lowest average at 28 kg/m².
Age and Gender Trends: The diagnosed group was generally older (mean age 63), while females represented 61% of the undiagnosed diabetes cases in this specific sample.
Predictive Modeling (Odds Ratio)
The study utilized a logistic regression model to determine how BMI predicts the likelihood of having undiagnosed diabetes:
Odds Ratio (OR): The estimated odds ratio for BMI is 1.10.
Interpretation: For every one-unit increase in BMI, the risk of having undiagnosed diabetes increases by approximately 10%.
Statistical Significance: The p-value for this relationship is effectively 0, indicating a highly significant association.
Clinical Classification Methodology
The dataset was categorized using a combination of survey responses and laboratory results:
Diagnosed Diabetes: Participants who self-reported a "Yes" to being told they have diabetes.
Undiagnosed Diabetes: Participants who reported "No" to a prior diagnosis but had laboratory HbA1c levels ≥ 6.5%.
At Risk / Prediabetes: Participants with no prior diagnosis and HbA1c levels between 5.7% and 6.4%.
No Diabetes: Participants with no prior diagnosis and HbA1c levels below 5.7%.
النتائج الرئيسية للتحليل الإحصائي
أظهرت البيانات المأخوذة من عينة إجمالية قدرها 4,940 مشاركاً وجود ارتباط وثيق بين زيادة مؤشر كتلة الجسم وحالة السكري:
متوسط مؤشر كتلة الجسم: كان متوسط الـ BMI لدى المصابين بـ "سكري غير مشخص" (Undiagnosed Diabetes) هو الأعلى بنسبة 34 ، يليهم المصابون بـ "سكري مشخص" بمتوسط 32.
الفئة الأكثر عرضة: من بين المصابين بسكري غير مشخص، بلغت نسبة الذين يعانون من السمنة (Obese) حوالي 67%
المقارنة مع الأصحاء: كان متوسط مؤشر كتلة الجسم للأفراد غير المصابين بالسكري هو الأدنى عند 28.
العلاقة الاحتمالية (نسبة الأرجحية)
استخدم التحليل نموذج الانحدار اللوجستي لتقدير مدى قدرة مؤشر كتلة الجسم على التنبؤ بالإصابة بالسكري غير المشخص:
نسبة الأرجحية (Odds Ratio): بلغت القيمة 1.10 تقريباً.
التفسير: هذا يعني أنه مع كل زيادة قدرها وحدة واحدة في مؤشر كتلة الجسم، تزداد احتمالية أن يكون الشخص مصاباً بسكري غير مشخص بنسبة تزيد عن 10%.
الأهمية الإحصائية: سجلت القيمة الاحتمالية (p-value) لمتغير BMI مستوى 0، مما يؤكد وجود علاقة ذات دلالة إحصائية قوية جداً.
منهجية التصنيف السريري
تم تصنيف المشاركين في الدراسة بناءً على المعايير التالية:
سكري مشخص: إذا أجاب المشارك بـ "نعم" على السؤال (DIQ010).
سكري غير مشخص: إذا أجاب بـ "لا" ولكن كانت نتائج فحص الهيموجلوبين السكري (HbA1c) تساوي أو تزيد عن 6.5.
مرحلة ما قبل السكري: إذا كان فحص HbA1c يتراوح بين 5.7 و 6.5.