Item Sales Analysis Dashboard
تفاصيل العمل

This project is a multi-page interactive sales analytics dashboard designed to provide a complete view of sales, profitability, and transaction-level details. The dashboard is structured into three main sections: Sales, Profits, and Details, enabling both high-level monitoring and deep operational analysis.
Sales Overview
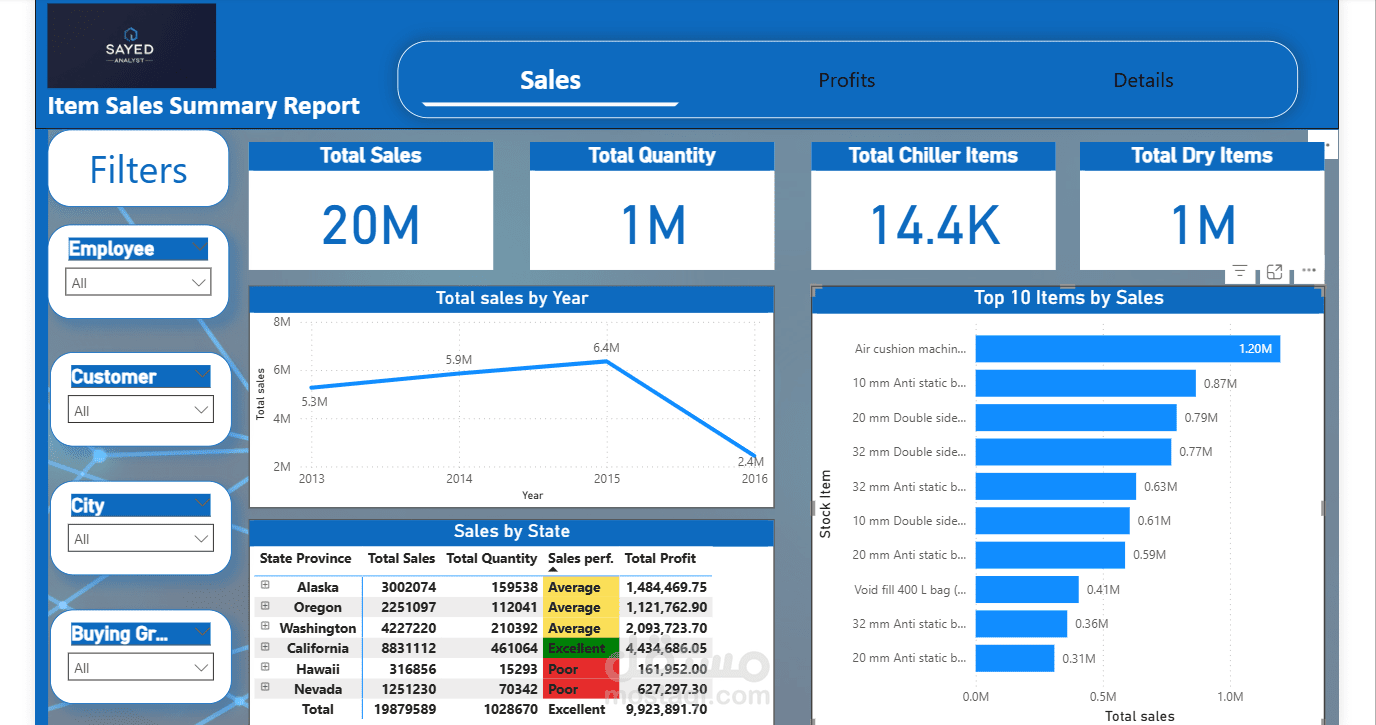
The Sales section focuses on overall business performance and volume metrics, including:
Total Sales
Total Quantity Sold
Total Chiller Items
Total Dry Items
Key visuals include:
Year-over-year sales trends.
Top 10 items by sales, highlighting best-performing products.
Sales by state, with performance indicators to classify states (Excellent, Average, Poor).
Interactive filters (Employee, Customer, City, Buying Group) allow users to dynamically slice the data and analyze specific segments.
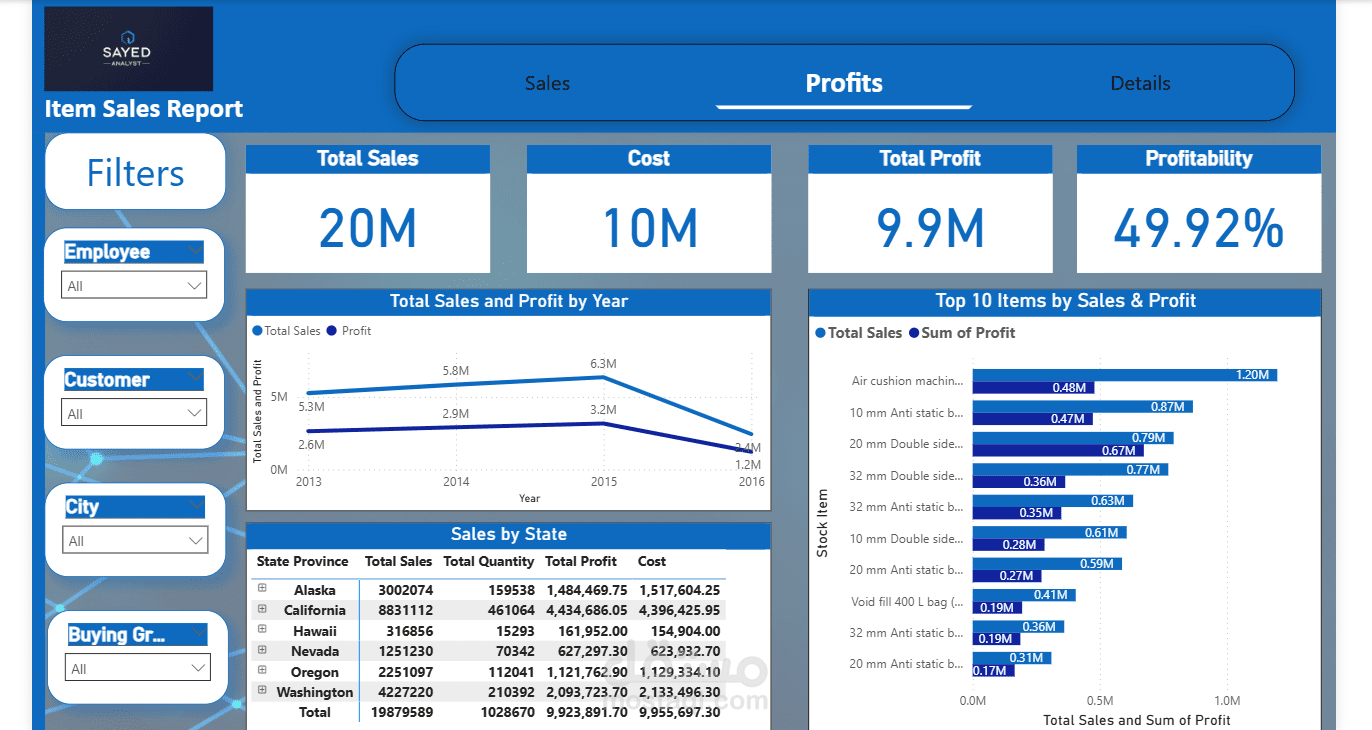
Profitability Analysis
The Profits section emphasizes financial efficiency and margins, featuring:
Total Cost
Total Profit
Overall Profitability Percentage
It includes:
Combined Sales vs. Profit trends by year.
Top 10 items by sales and profit, enabling comparison between revenue contribution and profitability.
State-level profit and cost breakdowns for regional performance evaluation.
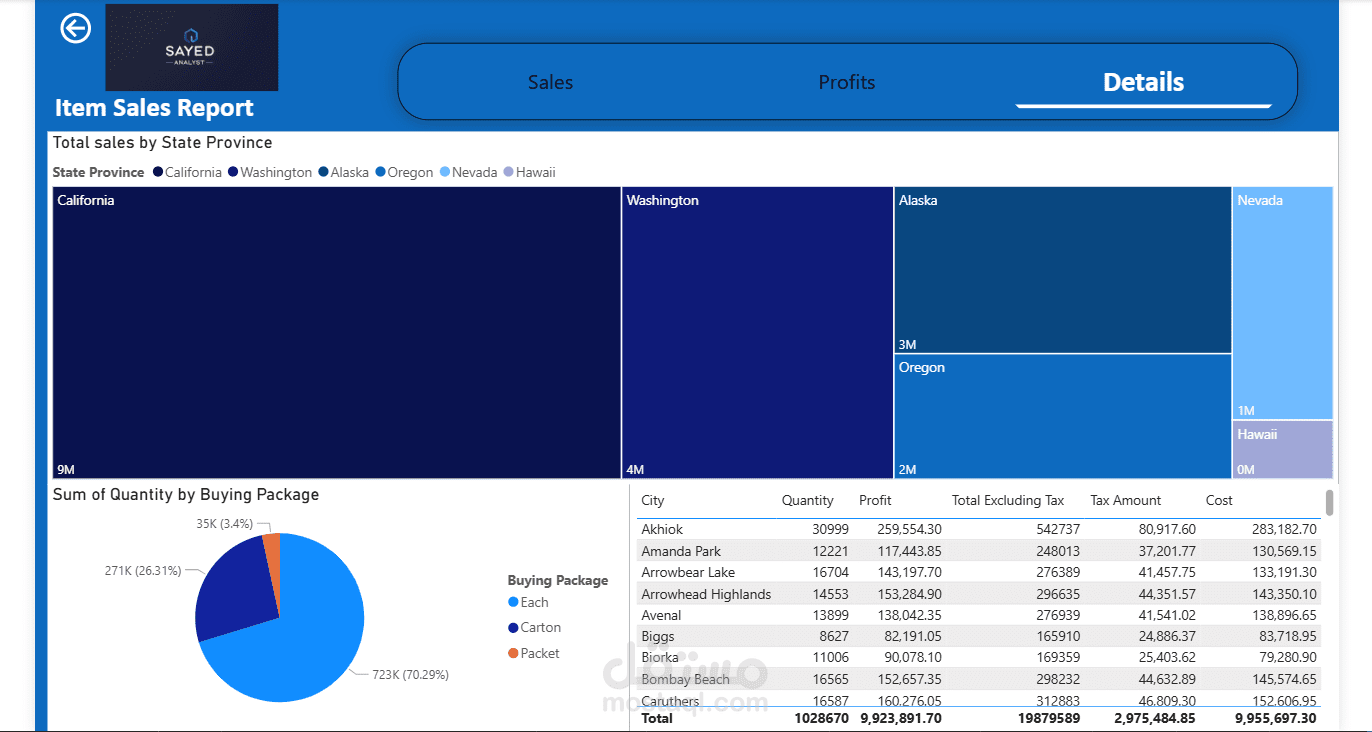
Detailed Insights
The Details section provides granular analysis for deeper decision-making:
Treemap of total sales by state, showing contribution weight by region.
Quantity distribution by buying package (Each, Carton, Packet).
A detailed transactional table including city-level quantity, profit, cost, tax amount, and net sales.
Skills Demonstrated
This project demonstrates strong capabilities in:
Business intelligence dashboard design
KPI definition and financial analysis
Data modeling and aggregation
Interactive filtering and navigation
Executive-ready data storytelling