Popular Movies Report (Dashboard)
تفاصيل العمل
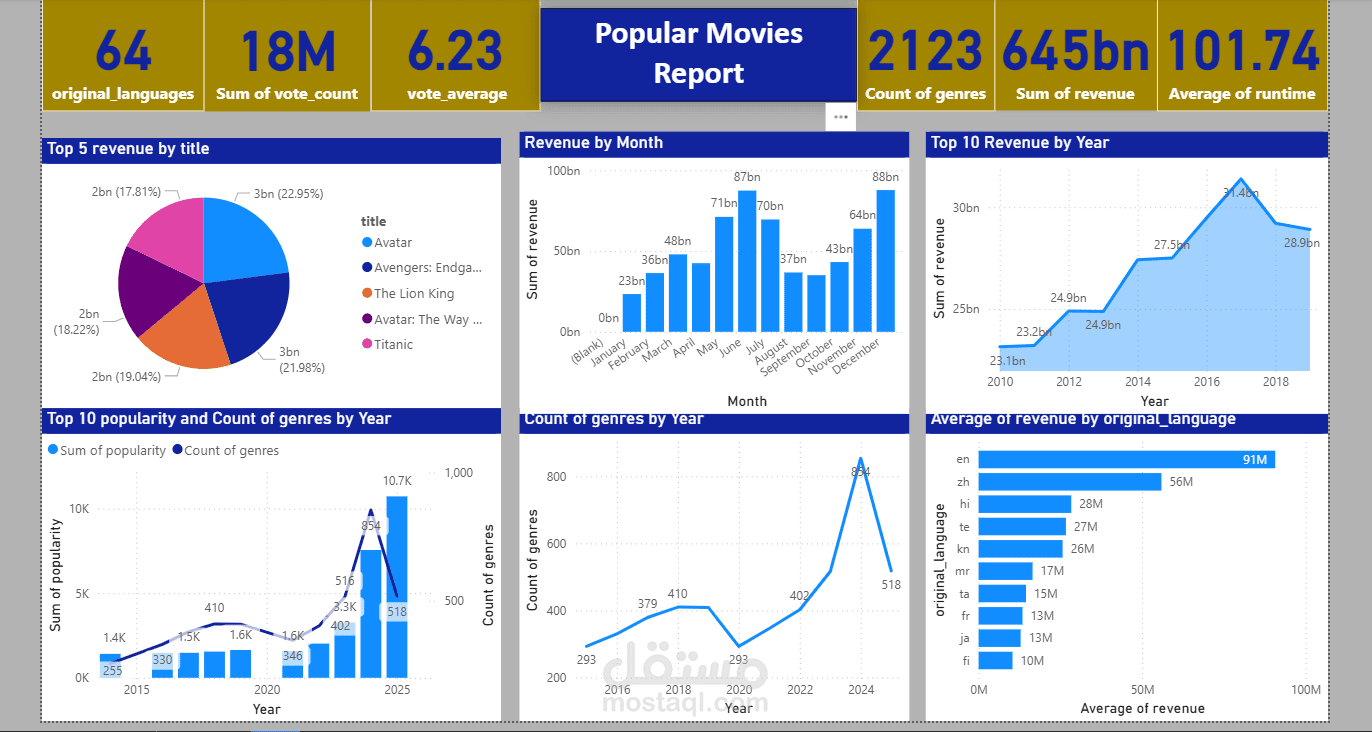
This project is an analytical dashboard for Popular Movies, designed to provide deep insights into movie performance using data-driven visualizations.
The report highlights key metrics at a glance, including:
Number of original languages
Total vote count
Average movie rating (vote average)
Total number of genres
Total revenue
Average runtime
The dashboard includes multiple analytical views such as:
Top 5 movies by revenue, showing revenue contribution by title.
Revenue by month, identifying seasonal trends in movie releases and earnings.
Top 10 revenue by year, illustrating long-term revenue growth patterns.
Popularity trends and genre count by year, combining audience interest with production diversity.
Genre count evolution over time, highlighting industry expansion and content variety.
Average revenue by original language, comparing financial performance across different languages.
This dashboard demonstrates strong capabilities in:
Data exploration and aggregation
Trend analysis and time-series visualization
KPI design for media and entertainment analytics
Interactive and executive-level reporting