Financial Analysis
تفاصيل العمل

I built an Interactive Financial Analysis & Simulator Dashboard in Power BI to help businesses make smarter, data-driven decisions.
? What this dashboard delivers:
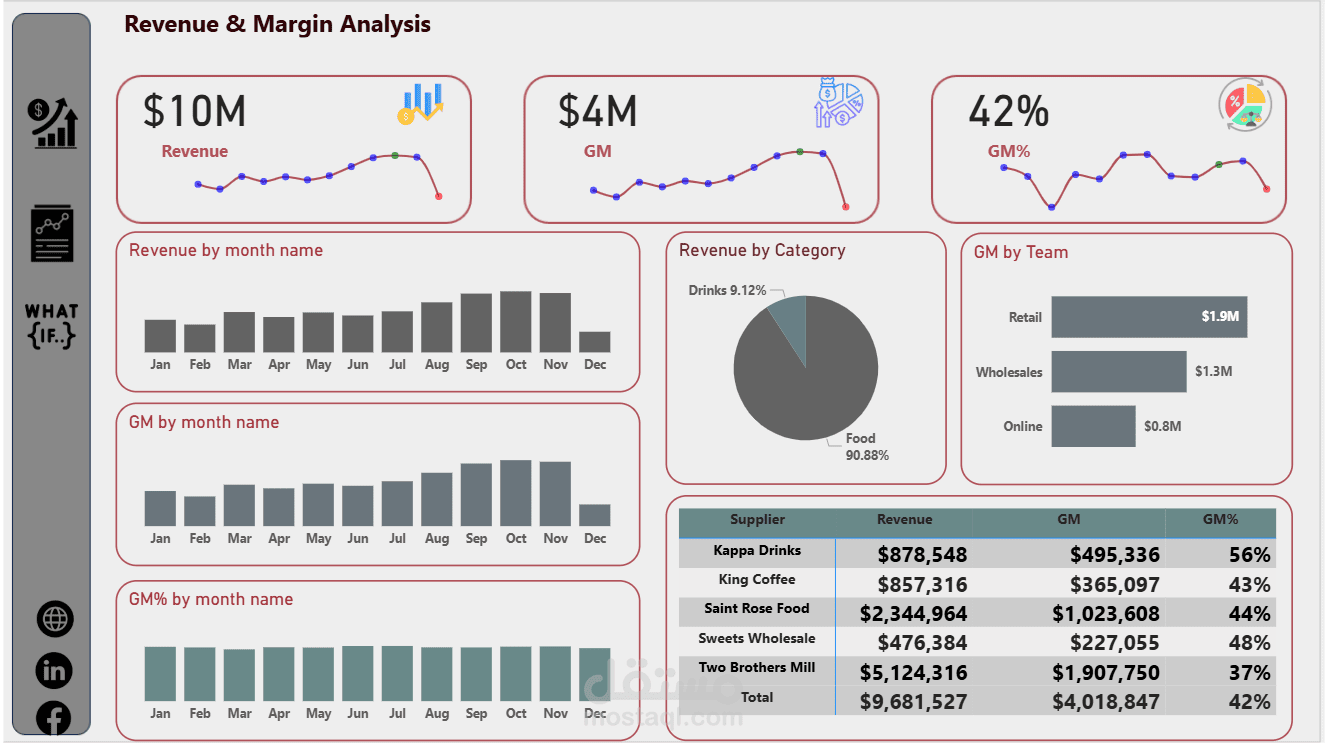
Revenue & Gross Margin tracking by month, category, supplier, and team
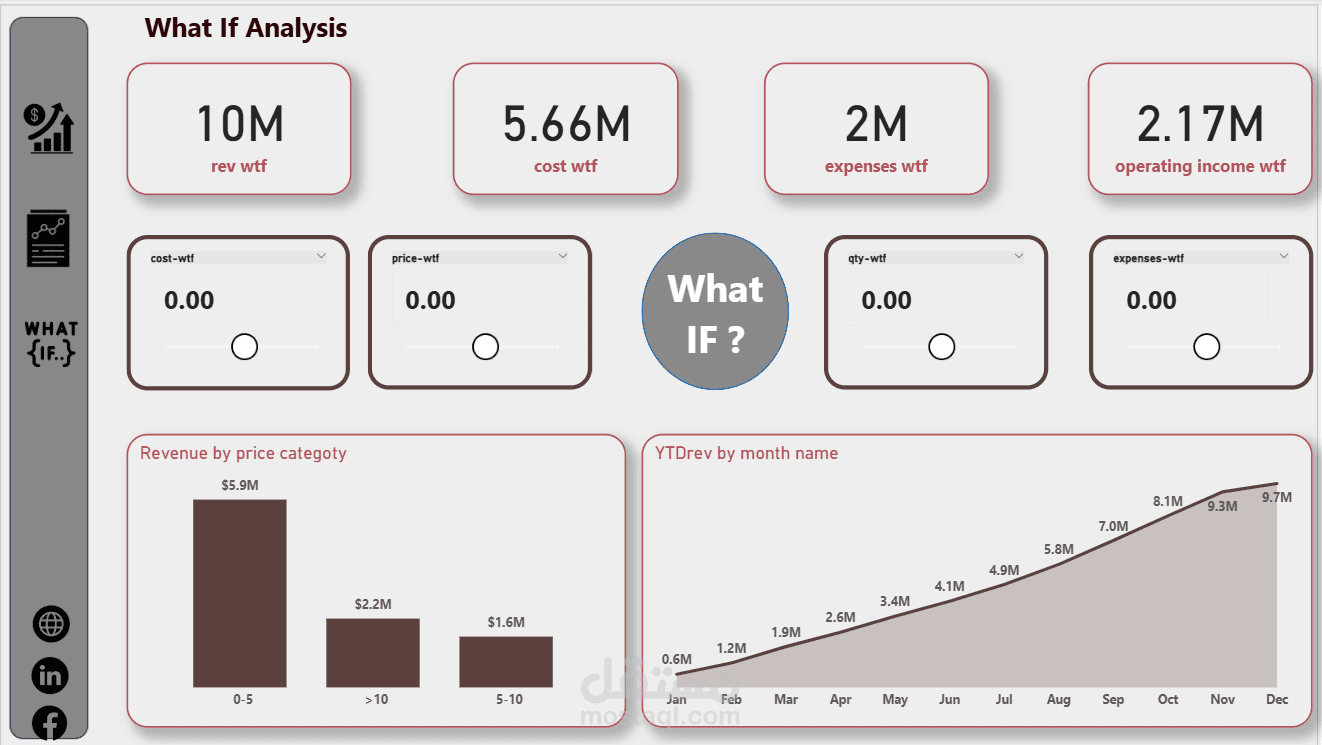
A What-If Simulator to test how price, cost, and quantity changes affect performance
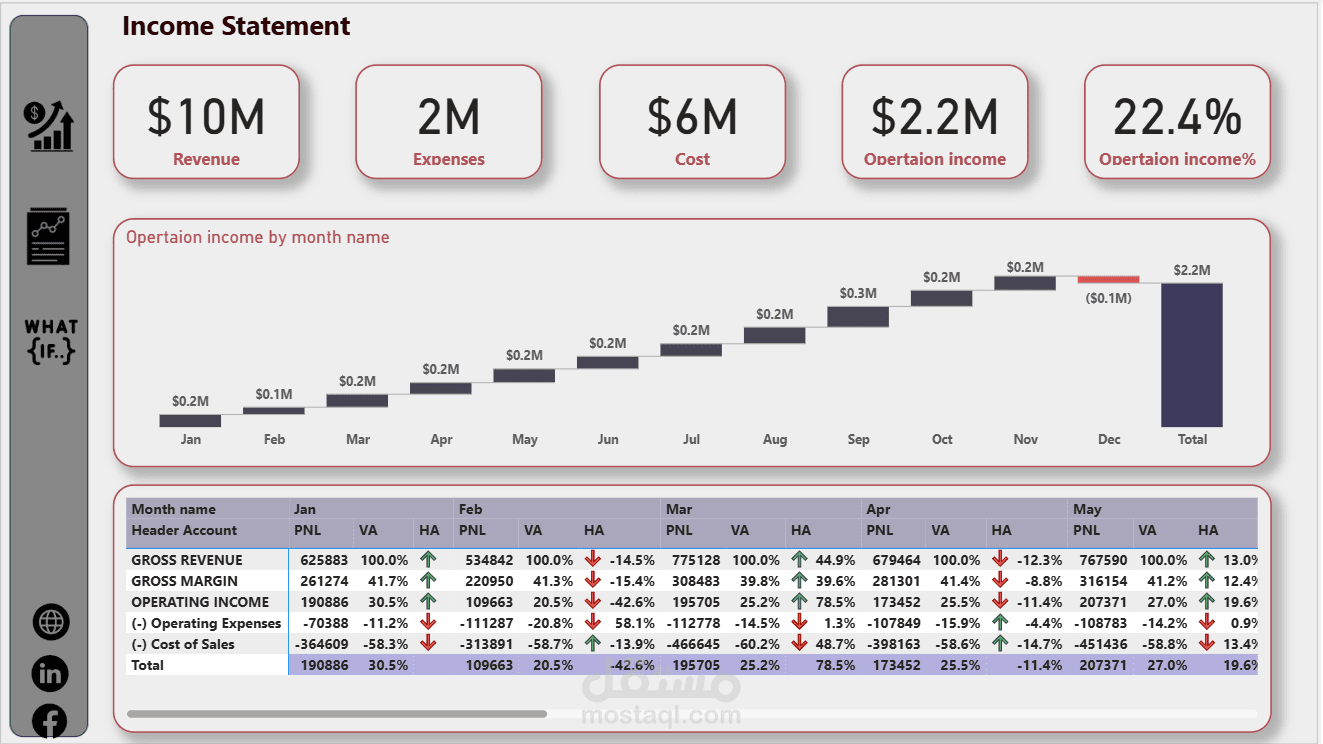
Operating Income with detailed monthly breakdowns
Clear storytelling through bar charts, donut charts, waterfall, and KPI cards
? Key Insights from the project:
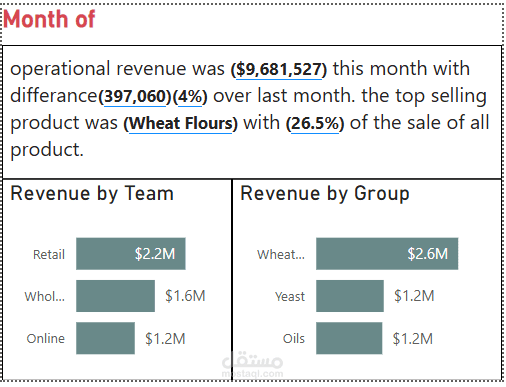
Revenue: $9.68M
Gross Margin: $4.02M (41.5%)
Operating Income: $2.17M
? Skills & Tools used:
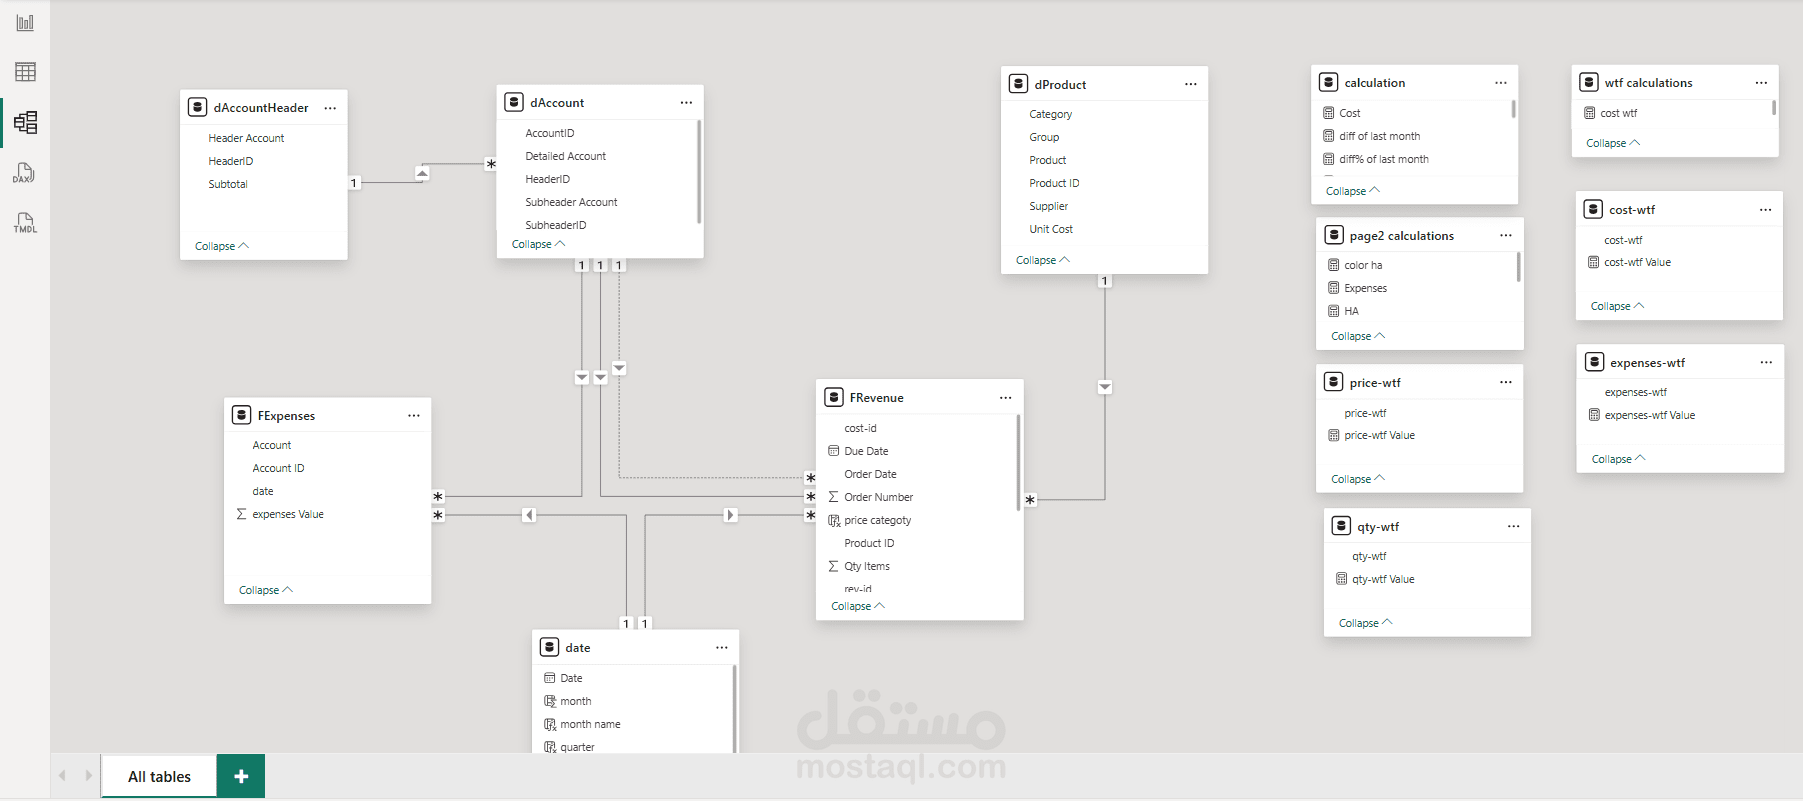
Power BI for visualization
DAX for dynamic financial calculations
What-If Parameters for scenario analysis
✨ This project helped me strengthen my financial modeling, data storytelling, and DAX logic skills.