Deep Dive Analysis Report for Call Center Performance
تفاصيل العمل
نظرة عامة على التحليل (Analysis Overview)
تمثل هذه اللوحة المرحلة النهائية والأكثر عمقًا في تحليل أداء مركز الاتصالات. بينما تقدم لوحات المعلومات الأخرى نظرة عامة على "ماذا" حدث، تم تصميم هذه الصفحة خصيصًا للإجابة على سؤال "لماذا" تحدث هذه النتائج.
من خلال التركيز على الأنماط الزمنية، دقة التخطيط، وتحليل الأسباب الجذرية، تعمل هذه الداشبورد كمركز تحليلي لمديري العمليات والمحللين، بهدف تحويل البيانات إلى قرارات تشغيلية استراتيجية ومستنيرة.
التحدي: ما وراء الأرقام السطحية
كان التحدي الرئيسي هو تجاوز مؤشرات الأداء السطحية، حيث أن الإدارة لم تكن بحاجة فقط إلى معرفة:
معدل التخلي، بل فهم لماذا يرتفع ومن المسؤول عنه.
حجم المكالمات، بل تحديد متى تصل وكيفية الاستعداد لها.
كان هناك حاجة ملحة لأداة قادرة على:
تشخيص المشاكل التشغيلية بدقة.
تحديد الأنماط المخفية.
ربط الأداء الضعيف بأسباب ملموسة يمكن معالجتها.
الحل: لوحة تحليل الأسباب الجذرية (Root Cause Analysis Dashboard)
تم تصميم الداشبورد كمجهر تحليلي يركز على أربعة محاور رئيسية:
تحليل الأنماط الزمنية (Temporal Pattern Analysis)
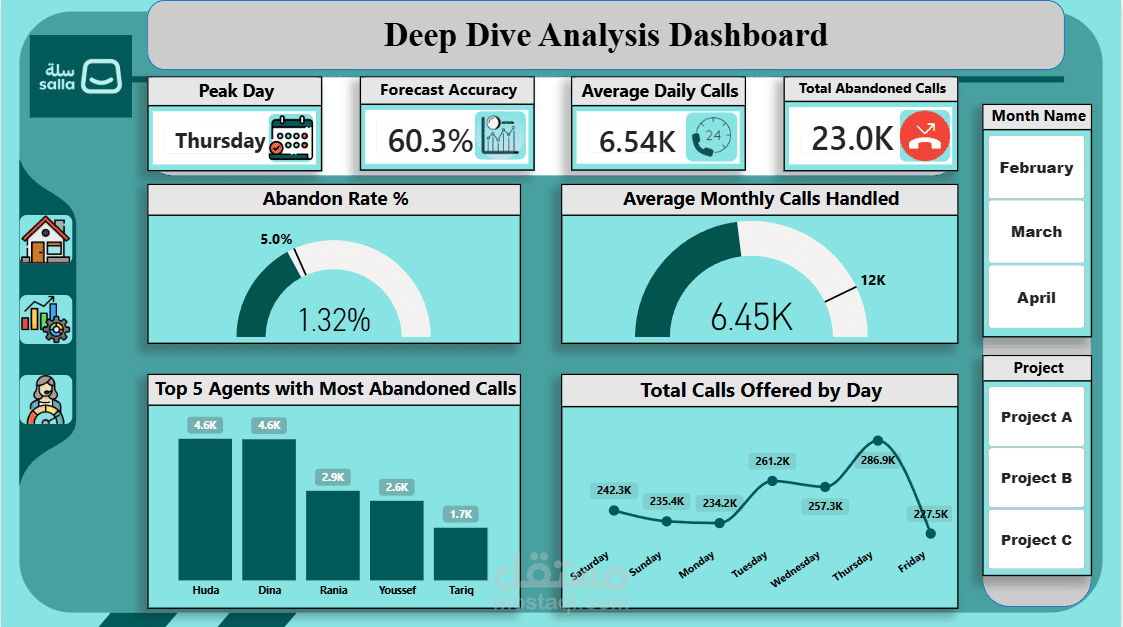
باستخدام الرسم البياني Total Calls Offered by Day، تمكنا من تحديد أيام الذروة والأيام الهادئة، مما يوفر أساسًا علميًا لجدولة الموظفين.
تحليل جودة التخطيط (Planning Quality Analysis)
مقياس Forecast Accuracy في المقدمة والوسط يمثل حجر الزاوية في كفاءة التشغيل، حيث يقيم جودة عملية التخطيط بأكملها، وليس مجرد عرض رقم.
تحليل الأداء مقابل الأهداف (Performance vs. Targets)
باستخدام Gauge Charts، تحولت الأهداف من أرقام في تقرير إلى مؤشرات مرئية حية.
مقياس Abandon Rate % يعرض الأداء مقابل هدف تجربة العميل.
مقياس Average Monthly Calls Handled يقيس الأداء مقابل هدف الإنتاجية.
تحديد المسؤولية الفردية (Individual Accountability Analysis)
الرسم البياني Top 5 Agents with Most Abandoned Calls يتيح للإدارة تحديد المصادر الرئيسية للمكالمات المتخلى عنها، وتحويل التركيز من المشكلة العامة إلى أسباب فردية محددة يمكن التعامل معها.
النتائج الرئيسية والرؤى القابلة للتنفيذ
أبرز النتائج التي قدمتها الداشبورد:
تحديد يوم الخميس كنقطة ضغط أسبوعية
يوم الخميس هو يوم الذروة المطلق، مما يتطلب إعادة توزيع الموارد لتحقيق أقصى كفاءة، وتقليل أوقات الانتظار، وتحسين تجربة العملاء.
تشخيص فشل نموذج التنبؤ
نسبة دقة التنبؤ المنخفضة (60.3%) كشفت خللًا في عملية التخطيط، مما حول تركيز الإدارة من التعامل مع "الأعراض" إلى معالجة السبب الجذري نفسه.
فجوة الأداء الإنتاجي
مقياس Average Monthly Calls Handled أظهر أن المركز يعمل بأقل من طاقته المستهدفة (6.45K مقابل هدف 12K)، مما أتاح نقاشًا استراتيجيًا حول أسباب المشكلة.
توجيه جهود التدريب بدقة
تحليل أفضل خمسة موظفين سمح للإدارة بتركيز التدريب والدعم على الأفراد الأكثر تأثيرًا، مما يوفر الوقت والموارد ويحقق نتائج أسرع.
الخلاصة:
هذه الداشبورد لم تعرض البيانات فقط، بل قامت بتشخيص المشاكل، تحديد أسبابها، وتقديم توصيات مدعومة بالبيانات، محولة دور قسم التحليل من "مُبلغ" إلى "شريك استراتيجي" في اتخاذ القرار.
Analysis Overview
This dashboard represents the final and most in-depth stage of call center performance analysis. While other dashboards provide a high-level overview of "what" happened, this page was specifically designed to answer "why" these results are occurring.
By focusing on temporal patterns, planning accuracy, and root cause analysis, this dashboard serves as an analytical hub for operations managers and analysts, aiming to transform data into strategic and informed operational decisions.
The Challenge: Beyond Surface-Level Metrics
The primary challenge this dashboard was designed to solve was moving beyond surface-level KPIs. Management needed more than just:
Knowing the abandon rate, they needed to understand why it is high and who is responsible.
Knowing the call volume, they needed to determine when calls arrive and how to prepare for them.
There was an urgent need for a tool capable of:
Accurately diagnosing operational problems.
Identifying hidden patterns.
Linking poor performance to tangible causes that could be addressed.
The Solution: A Root Cause Analysis Dashboard
This dashboard functions as an analytical "microscope", focusing on four key areas:
Temporal Pattern Analysis
Through the Total Calls Offered by Day visual, the week was broken down to clearly identify peak and off-peak days, providing a scientific basis for staff scheduling.
Planning Quality Analysis
The Forecast Accuracy metric was placed front and center as the cornerstone of operational efficiency. This metric evaluates the quality of the entire planning process, not just a number.
Performance vs. Targets Analysis
Using Gauge Charts, business targets were transformed from static numbers into living, visual indicators.
Abandon Rate % gauge measures performance against the customer experience goal.
Average Monthly Calls Handled gauge measures performance against the productivity target.
Individual Accountability Analysis
The Top 5 Agents with Most Abandoned Calls chart allows management to pinpoint the primary sources of abandoned calls, shifting the focus from general problems to specific, addressable causes.
Key Findings & Actionable Insights
This dashboard delivered deep and direct analytical insights, including:
Pinpointing Thursday as a Weekly Pressure Point
Data revealed Thursday as the absolute peak day, requiring special attention in scheduling.
This insight allows for resource reallocation to maximize efficiency, reduce wait times, and improve customer experience.
Diagnosing the Failure of the Forecasting Model
The low forecast accuracy (60.3%) exposed a fundamental flaw in planning.
Management focus shifted from dealing with symptoms (e.g., high agent pressure) to addressing the root cause.
Identifying a Productivity Performance Gap
The Average Monthly Calls Handled metric showed the center operating below its target (6.45K vs. 12K).
This insight enabled discussions on whether the issue was staffing levels or the realism of the target itself.
Enabling Precision in Coaching Efforts
Analysis of the top five agents allowed management to provide targeted support instead of generic training, saving time and resources while achieving faster results.
Summary:
This dashboard did not just present data; it diagnosed problems, identified root causes, and provided data-backed recommendations. It successfully transformed the role of the analytics department from a mere "reporter" to a "strategic partner" in decision-making.