Tutor Capacity Dashboard
تفاصيل العمل

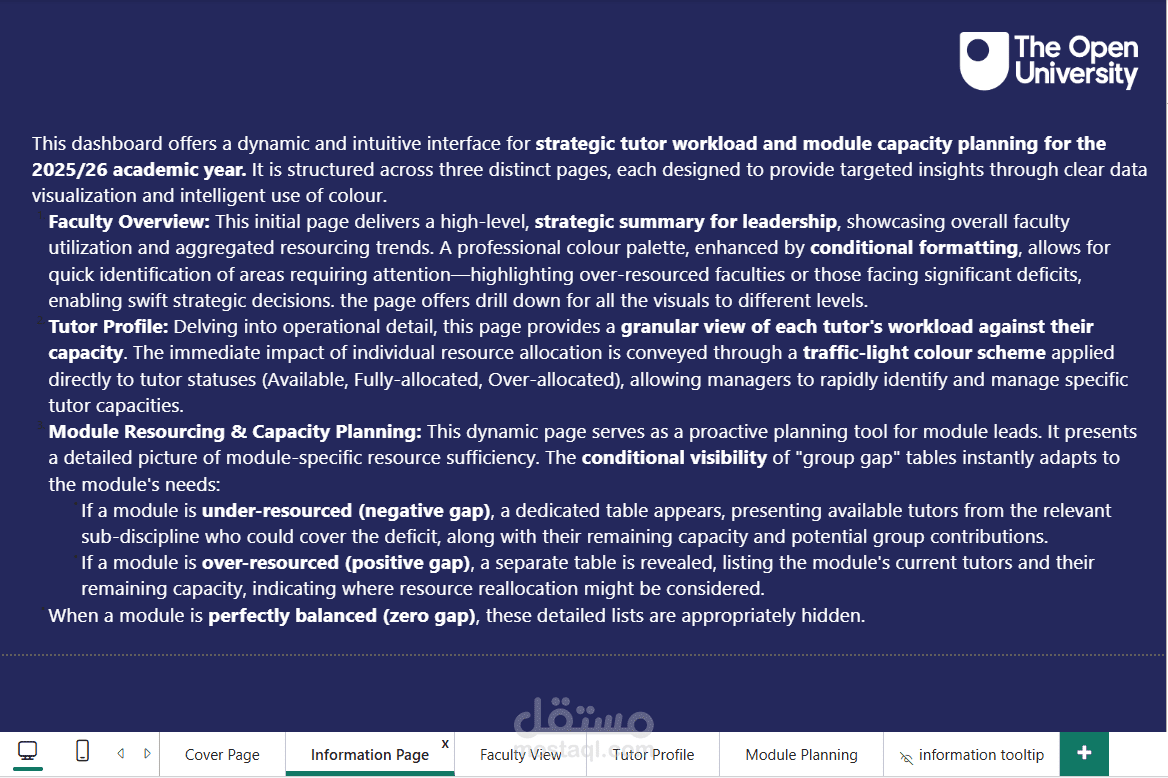
This dashboard offers a dynamic and intuitive interface for strategic tutor workload and module capacity planning for the 2025/26 academic year. It is structured across three distinct pages, each designed to provide targeted insights through clear data visualization and intelligent use of colour.
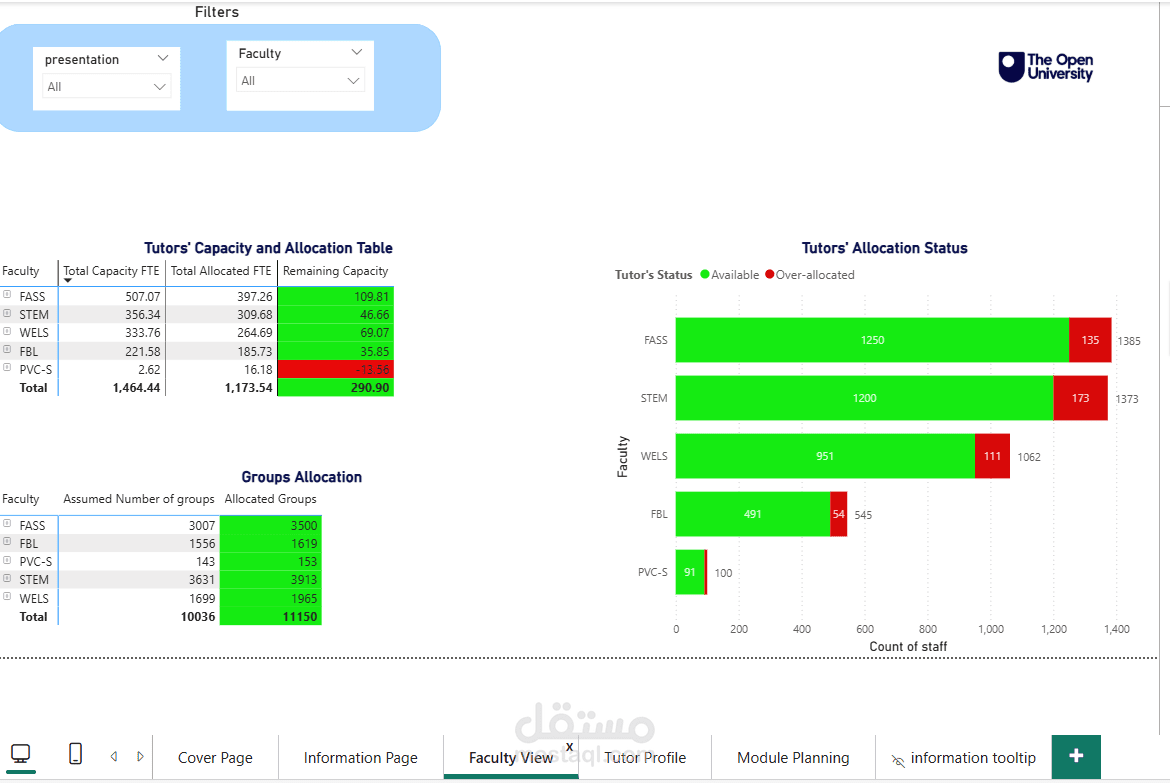
Faculty Overview: This initial page delivers a high-level, strategic summary for leadership, showcasing overall faculty utilization and aggregated resourcing trends. A professional colour palette, enhanced by conditional formatting, allows for quick identification of areas requiring attention—highlighting over-resourced faculties or those facing significant deficits, enabling swift strategic decisions. the page offers drill down for all the visuals to different levels.
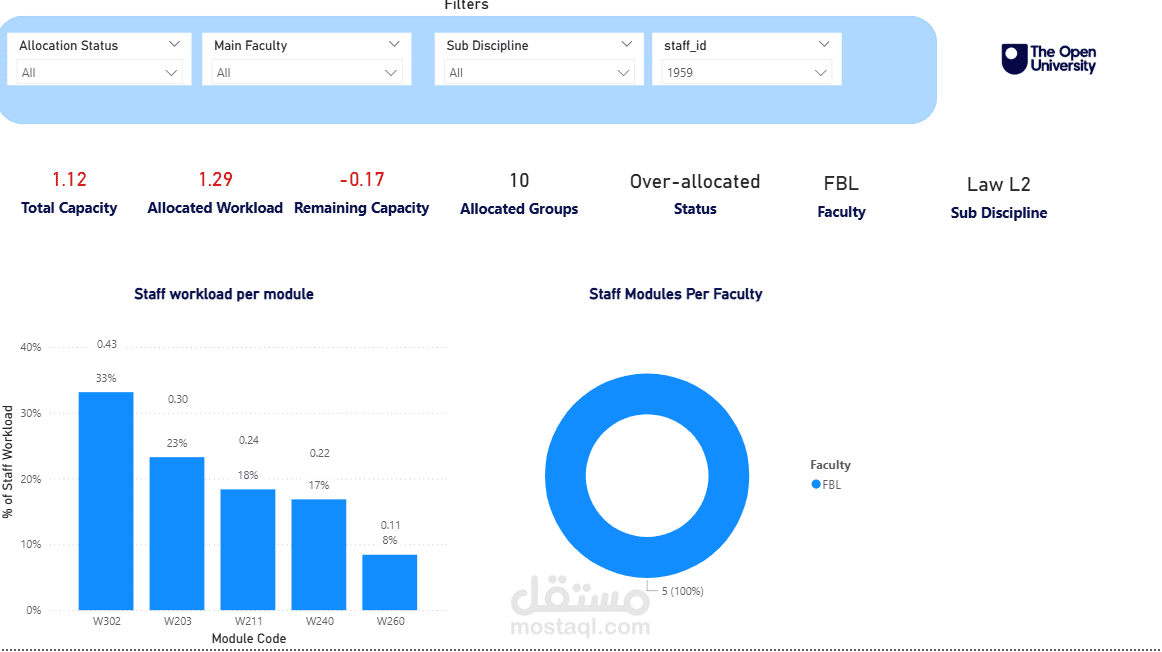
Tutor Profile: Delving into operational detail, this page provides a granular view of each tutor's workload against their capacity. The immediate impact of individual resource allocation is conveyed through a traffic-light colour scheme applied directly to tutor statuses (Available, Fully-allocated, Over-allocated), allowing managers to rapidly identify and manage specific tutor capacities.
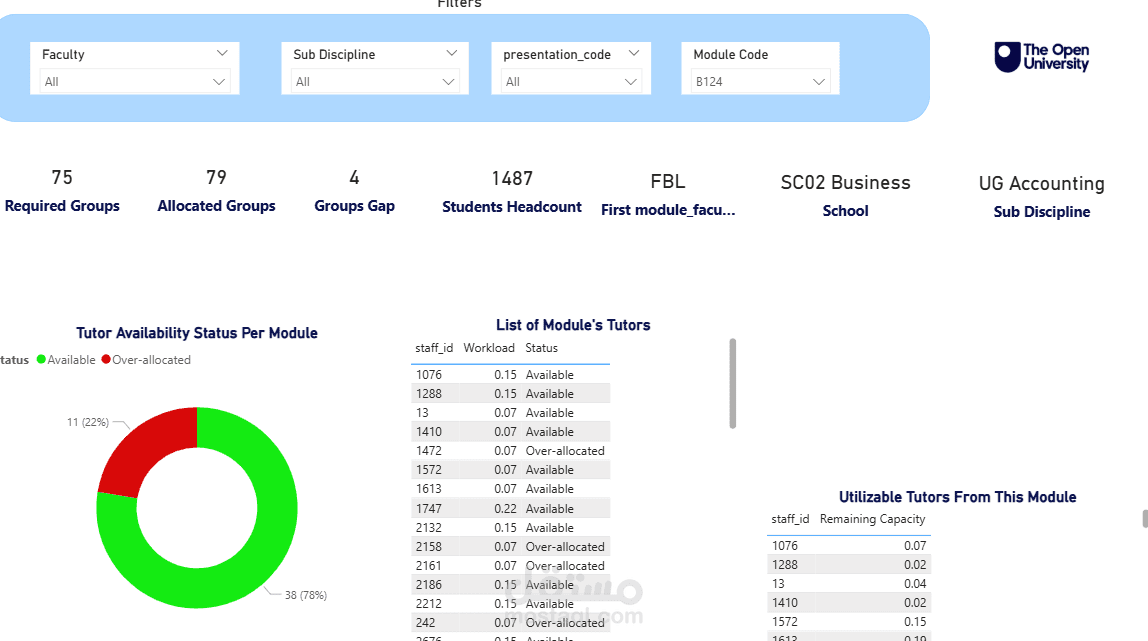
Module Resourcing & Capacity Planning: This dynamic page serves as a proactive planning tool for module leads. It presents a detailed picture of module-specific resource sufficiency. The conditional visibility of "group gap" tables instantly adapts to the module's needs:
If a module is under-resourced (negative gap), a dedicated table appears, presenting available tutors from the relevant sub-discipline who could cover the deficit, along with their remaining capacity and potential group contributions.
If a module is over-resourced (positive gap), a separate table is revealed, listing the module's current tutors and their remaining capacity, indicating where resource reallocation might be considered.
When a module is perfectly balanced (zero gap), these detailed lists are appropriately hidden.