FIFA World Cup 2018 Summary
تفاصيل العمل
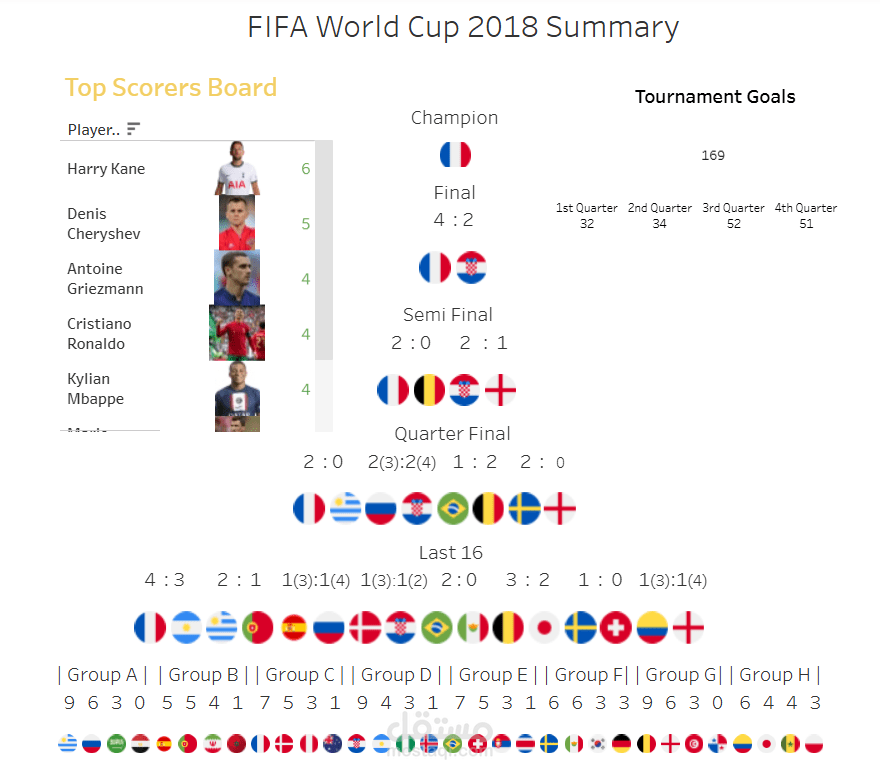
This dashboard showcases advanced data visualization techniques used to analyze the 2018 World Cup. Key Features:
Hierarchical Match Progression: A custom-built visual tree tracking results from the "Last 16" through to the Final, including penalty shootout scores.
KPI Tracking: Visualization of total tournament goals broken down by time intervals (quarters).
Rich Data Integration: A ranked leaderboard combining quantitative data (goals) with qualitative assets (player photos) for enhanced engagement.
Group Stage Summary: A compact overview of group-level points and standings.