cost and target
تفاصيل العمل
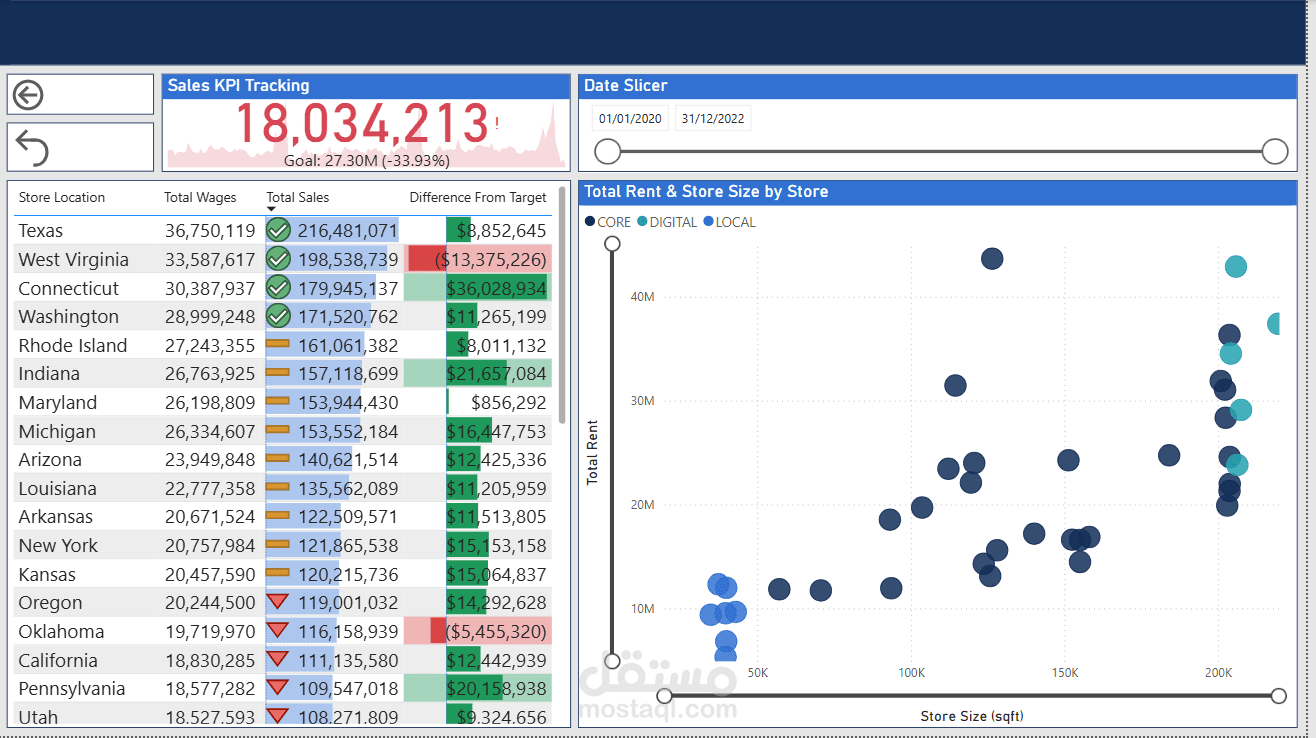
This dashboard is a sales performance and store analysis dashboard that combines KPI tracking, regional performance, and store metrics. Here’s a detailed breakdown of its components:
1. Header Section
Title/Theme: The dashboard is focused on sales KPI tracking and store-related metrics.
Date Slicer: Located at the top-right, it allows filtering data between 01/01/2020 and 31/12/2022 using a slider.
2. KPI Tracking (Top Center)
Sales KPI Tracking:
Current Sales: 18,034,213
Goal: 27.30M
Performance: -33.93% below target
Visual: A sparkline graph behind the number shows the trend over time.
3. Regional Performance Table (Left Panel)
Columns:
Store Location: States like Texas, West Virginia, Connecticut, etc.
Total Wages: Ranges from ~18M to ~36M.
Total Sales: Varies by state (e.g., Texas: 216,481,071; Utah: 108,271,809).
Difference From Target: Shows positive or negative variance in green/red bars.
Example:
Texas: -8,852,645 (below target)
Pennsylvania: +20,153,938 (above target)
Color Coding:
Green = Above target
Red = Below target
4. Scatter Plot (Right Panel)
Title: Total Rent & Store Size by Store
Axes:
X-axis: Store Size (sq ft) (ranges from ~0 to 200K)
Y-axis: Total Rent (ranges from ~0 to 50M)
Data Points:
Each dot represents a store, categorized by type:
CORE (dark blue)
DIGITAL (teal)
LOCAL (light blue)
Larger stores tend to have higher rent, but there’s variation across store types.
.