Interactive Dashboard
تفاصيل العمل
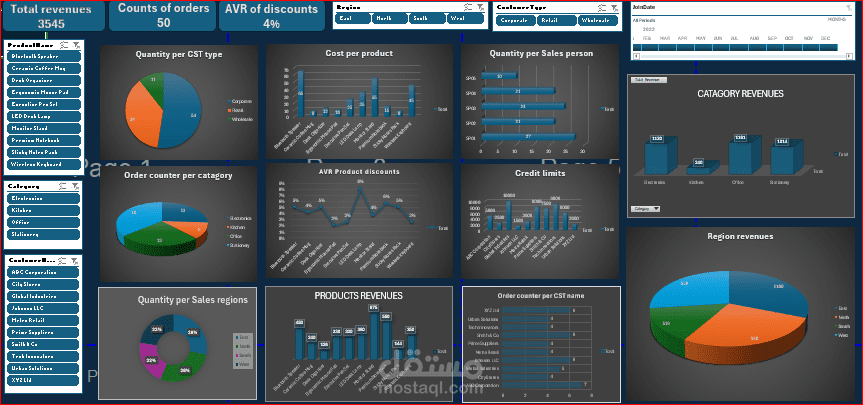
This dashboard provides a comprehensive overview of sales performance, customer demographics, and product metrics. It is designed for high-level monitoring and detailed filtering across regions and customer types.
### **Key Performance Indicators (KPIs)**
* **Total Revenues:** 3,545
* **Count of Orders:** 50
* **Average (AVR) Discount:** 4%
---
### **Core Data Visualizations**
* **Sales Distribution:** Pie and donut charts break down quantities by **Customer Type** (Corporate, Retail, Wholesale) and **Sales Region** (East, North, South, West).
* **Revenue Analysis:** Bar charts show revenue by **Category** (Electronics, Kitchen, Office, Stationery) and by individual **Product Name**. The "East" region appears to lead in regional revenue.
* **Product Performance:** A line graph tracks **AVR Product Discounts**, while bar charts display **Cost per Product** and **Quantity per Salesperson**.
* **Customer Insights:** Bar charts detail **Credit Limits** by company and **Order Counts** per specific customer name (e.g., ABC Corporation, XYZ Ltd).
### **Interactive Controls**
The dashboard features several slicers on the left and top margins, allowing users to filter the entire view by:
* **Product Name** and **Category**
* **Customer Name** and **Type**
* **Geographic Region**
* **Join Date** (using a timeline slider)