Sales Analysis
تفاصيل العمل
This project is more than just reports; it’s a practical tool to support decision-making at the executive level, sales teams, and marketing.
? Tools & Techniques:-
➡️Power BI (Data Modeling & Visualization)
Snowflake Schema
➡️DAX Measures (KPIs, Time Intelligence, YTD, % Change)
➡️Drill-Through & Dynamic Filters
➡️Row Level Security (RLS)
Dashboards:-
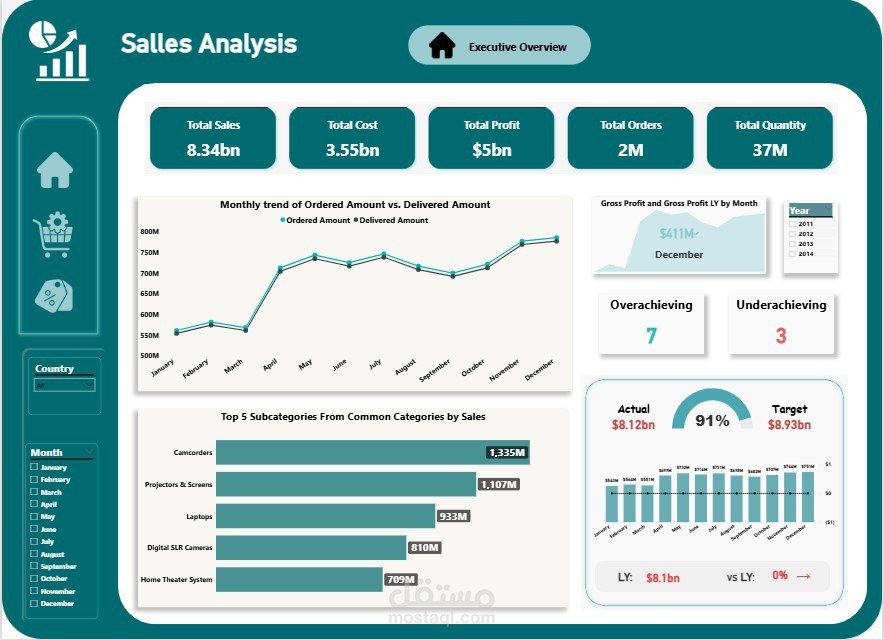
Executive Dashboard
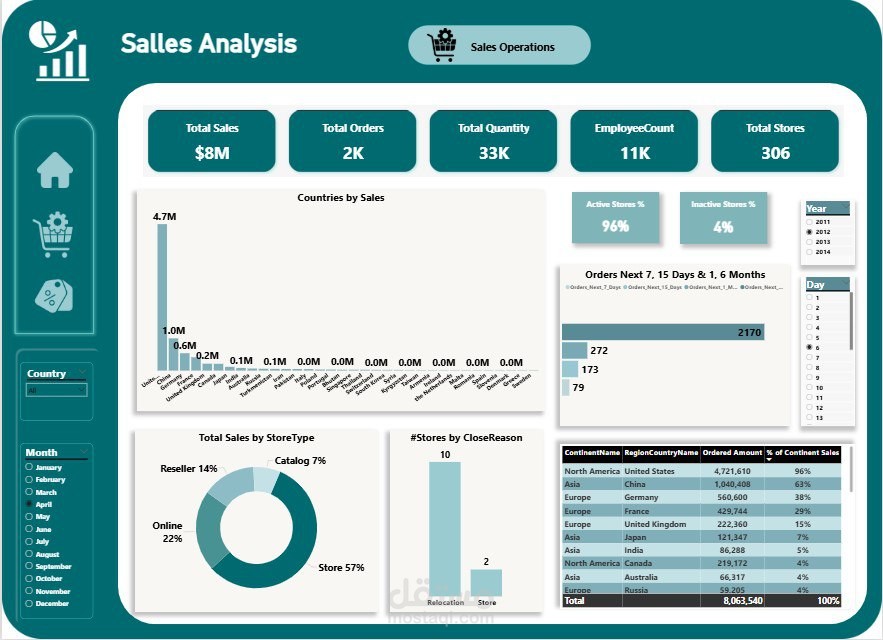
Sales / Operational Dashboard
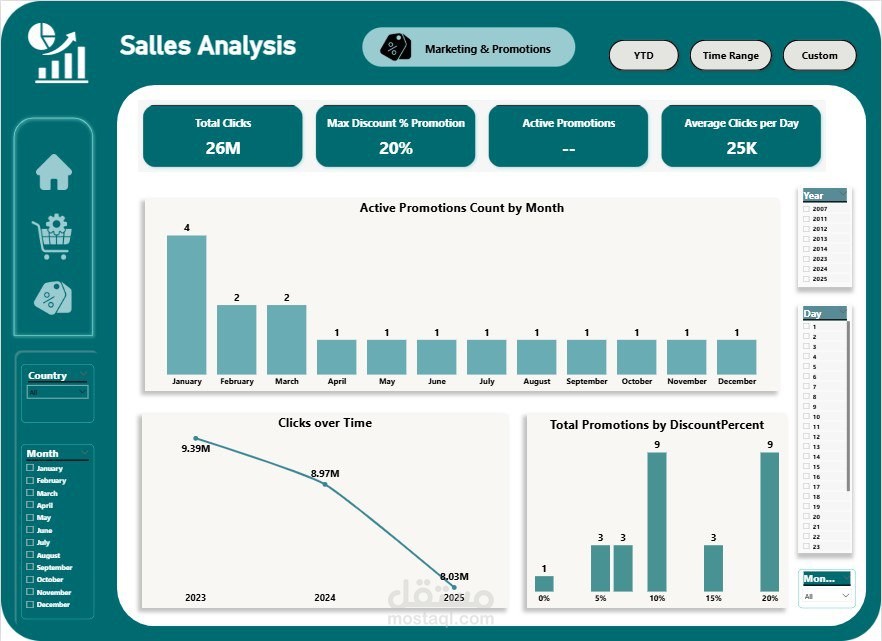
Marketing Analysis Dashboard
Key Metrics:-
↪️Total Sales: $4.7M
↪️Top Countries: USA, China, Canada
↪️Top Products: Camcorders ($1.34M), Projectors ($1.11M)
↪️Revenue stability across key periods
↪️Strong alignment between orders and deliveries → operational efficiency
↪️December had the highest order volume
↪️83% of store closures were due to relocation
Insights & Recommendations
Target new segments like students an content creators
Strengthen performance in the US market and expand in China
Focus more on top-selling products
Launch seasonal offers at strategic periods
Improve user experience supported by effective digital campaigns