داش بورد بالاكسل لبراند من موقع kggle
تفاصيل العمل
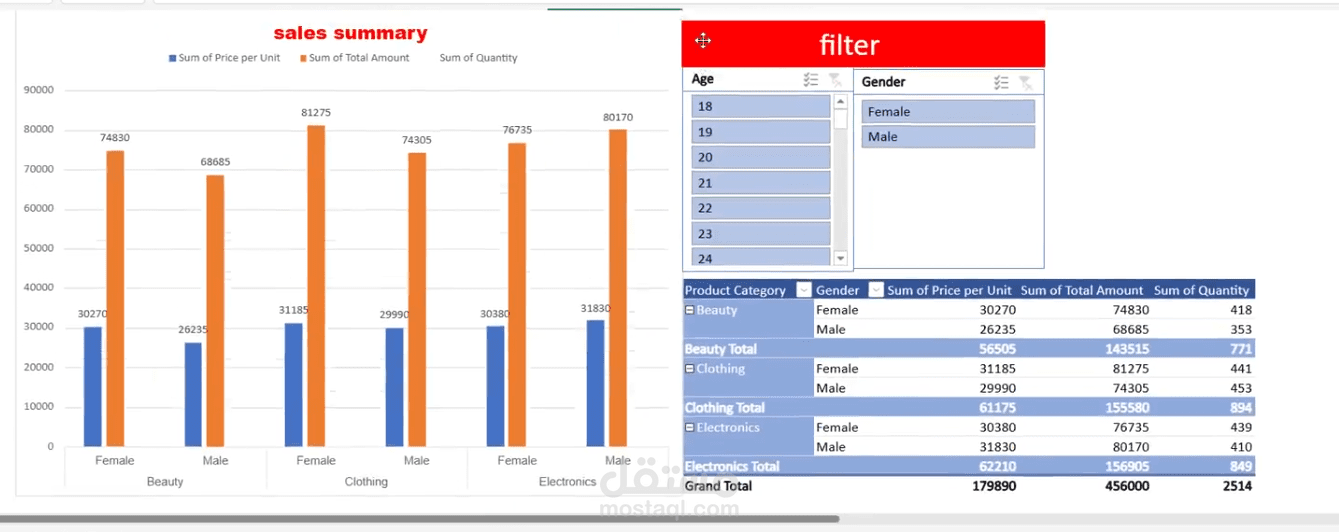
dashboard by excel by using pivot table to show sales in year 2023 and show which category in three category (beauty ,clothes, electronics ) is the important and high in sales ?
and made bar chart and slicer to solve this question :
which gender is maximum in buy category and what age of this category ?
what is interest of people based on age ?
are the gender related to sales category if they buy (beauty ,clothes, electronics) ?
all of them question dashboard was solved it ❤️