adidas sales dashboard
تفاصيل العمل

1- Data Preprocessing :
-Imported an Excel dataset and converted it into CSV for easier processing
-Cleaned column names, removed missing values, and ensured consistency
-Visualized boxplots to detect outliers in key metrics
-Applied the IQR method to detect and handle outliers
-Used log transformation to reduce skew and improve visual clarity
-Generated styled summary tables and comparative plots
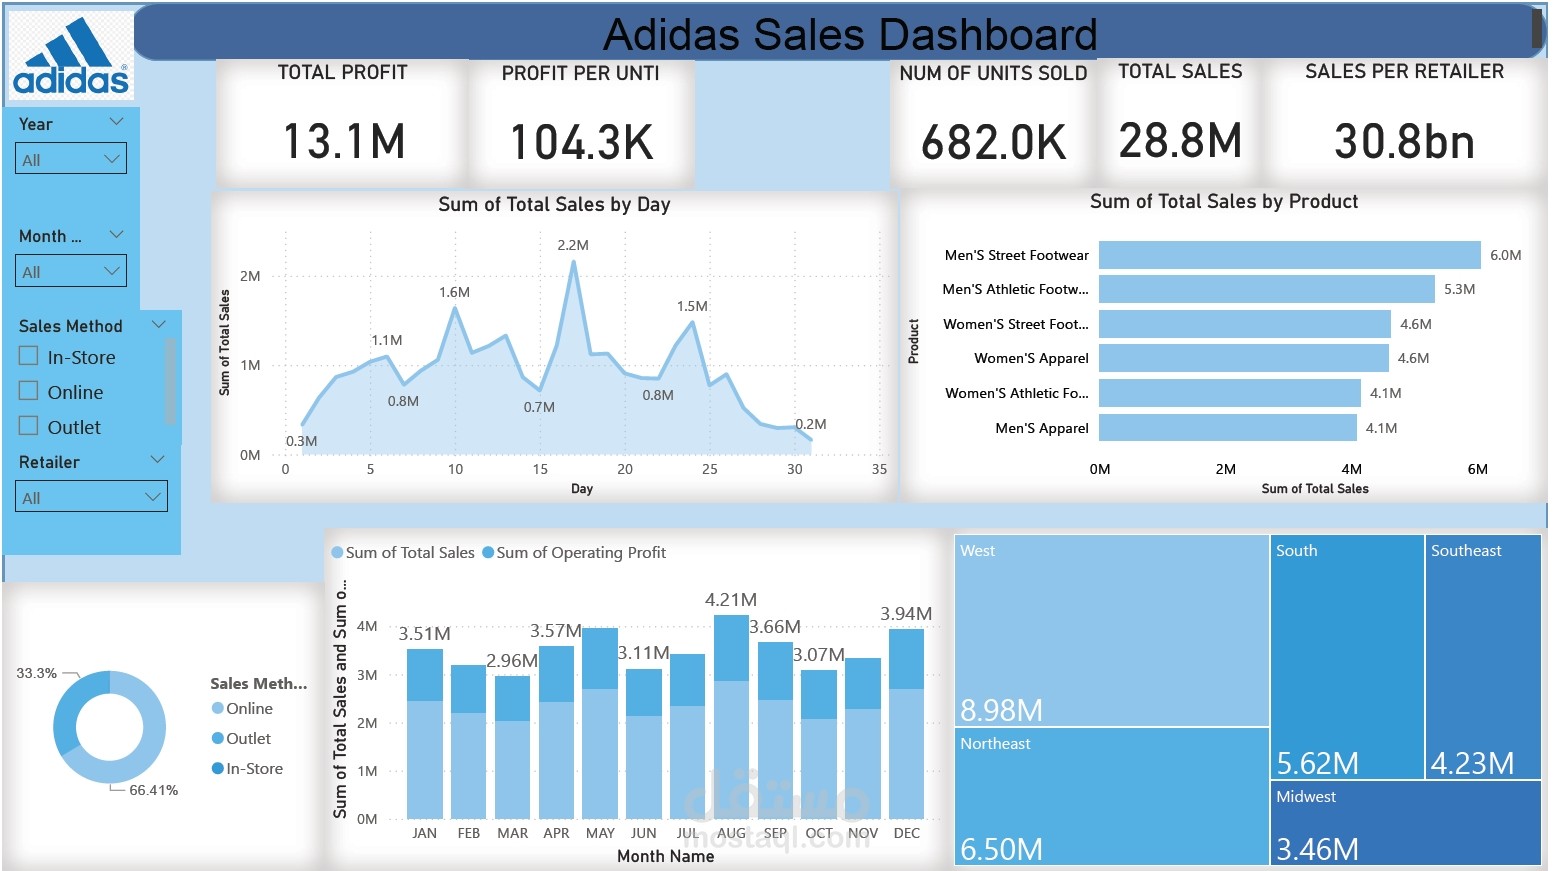
2-? Power BI Dashboard
-Designed a fully interactive dashboard to explore:
-Total Sales & Profit metrics
-Sales by Region, Product, and Retailer
-Seasonal trends across months and days
-Sales breakdown by method (In-store, Online, Outlet)
1- Data Preprocessing : -Imported an Excel dataset and converted it into CSV for easier processing -Cleaned column names, removed missing values, and ensured consistency -Visualized boxplots to detect outliers in key metrics -Applied the IQR method to detect and handle outliers -Used log transformation to reduce skew and improve visual clarity -Generated styled summary tables and comparative plots 2-? Power BI Dashboard -Designed a fully interactive dashboard to explore: -Total Sales & Profit metrics -Sales by Region, Product, and Retailer -Seasonal trends across months and days -Sales breakdown by method (In-store, Online, Outlet)
Skills: Dashboards · Microsoft Power BI · Exploratory Data Analysis (EDA) · Data Visualization