Sales Performance Dashboard – Power BI
تفاصيل العمل
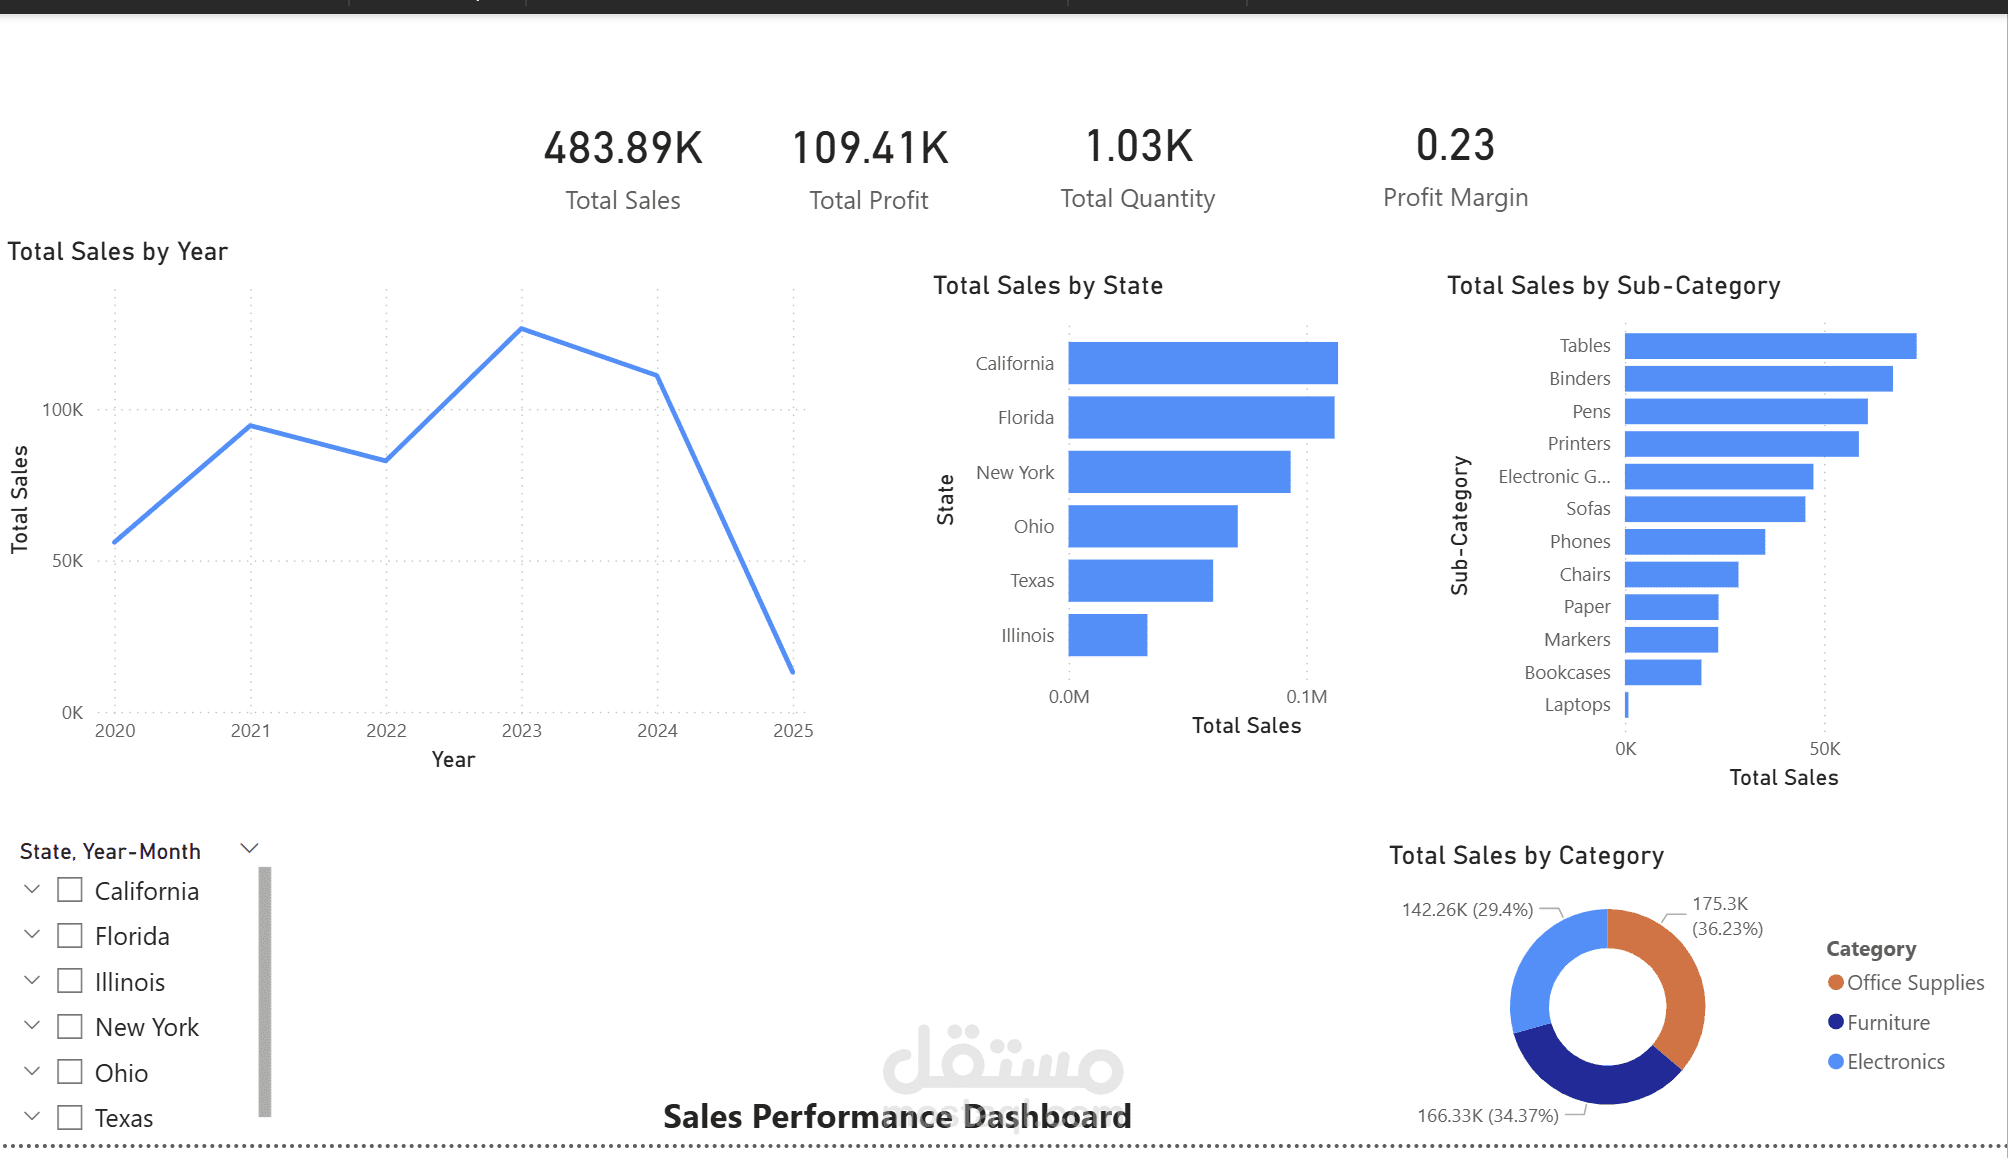
Sales Performance Dashboard – Power BI
This interactive dashboard visualizes key sales metrics across time, geography, and product categories. Built using Power BI Desktop, it showcases:
- Top-level KPIs: Total Sales, Profit, Quantity, and Profit Margin for quick executive insights.
- Geographic Breakdown: Bar chart comparing sales across major U.S. states.
- Product Insights: Sub-category and category-level sales distribution via bar and donut charts.
- Dynamic Filtering: Slicers for State and Year-Month enable user-driven exploration.
Designed for business stakeholders to monitor performance, identify growth opportunities, and guide strategic decisions. This dashboard demonstrates my ability to transform raw data into actionable insights using Power BI’s data modeling, DAX, and visualization tools.