Electric Vehicle in 2025 — Power BI Market Performance Dashboard
تفاصيل العمل

? Project Overview
This project explores the 2025 global electric vehicle (EV) market, focusing on key metrics such as battery capacity, driving range, efficiency, and top speed.
The goal was to uncover how different brands and models compare across these performance indicators and to visualize emerging trends in EV technology.
? Tools & Technologies
Tool Purpose
Power BI Interactive dashboards, DAX measures, KPI visuals
Visual Studio + Python: Automated data enrichment and image sourcing
AI Assistant (Claude) Supported Python script generation for web scraping
Notion Task management and project documentation
? Data Summary
The dataset contains detailed specifications for 2025 electric vehicle models, including [brand, model, top_speed_km/h, battery_capacity_kWh, torque_Nm, efficiency_W/km, range_km, acceleration_0_100_s, fast_charging_power_kW, fast_charge_port, towing_capacity_kg, cargo_volume_l, seats, segment, drivetrain, car_body_type, source_URL]
After cleaning, the dataset represented multiple EV brands and model categories, enhanced with image URLs and efficiency ranks.
⚙️ Data Preparation Process
1. Cleaning
Removed non-relevant or redundant columns:
length_mm, width_mm, height_mm, battery_type, number_of_cells, and unreliable efficiency_W/km.
2. Transformation
Re-calculated Efficiency (Wh/km): Efficiency = (Battery Capacity [kWh] * 1000) / Range [km]
Created Efficiency Rank using conditional logic:
High Efficiency → < 180 Wh/km
Mid Efficiency → 180–200 Wh/km
Low Efficiency → > 200 Wh/km
3. Enrichment
Used a Python script (AI-assisted) to collect vehicle images and compile vehicle_images.csv.
Linked each vehicle model to its corresponding image and brand logo.
4. Modeling
Built relationships between:
EV (main dataset)
vehicle_images
Added supporting tables for battery capacity and speed filters.
? Power BI Dashboard Highlights
? Color Palette: #FF9900, #DC7D00, and #8F3E00, with neutral grays for readability.
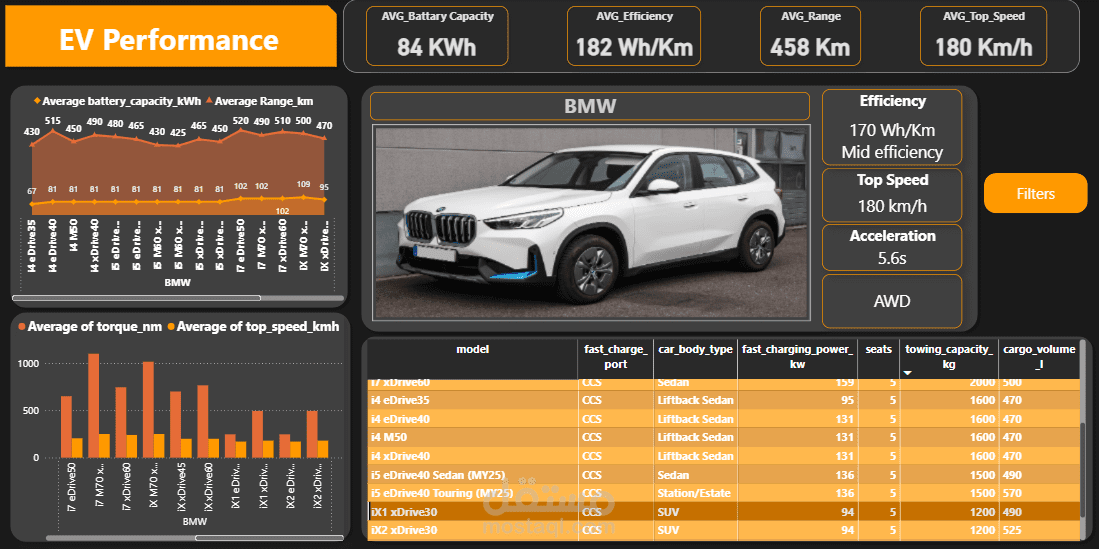
? Dashboard Features
KPI Cards
? Avg. Battery Capacity → 86 kWh
⚡ Avg. Efficiency → 181 Wh/km
? Avg. Range → 478 km
? Avg. Top Speed → 180 km/h
Visuals
Area Chart → Avg. Battery Capacity vs. Avg. Range
Column Chart → Avg. Torque & Top Speed per Model
Dynamic Image Gallery → Vehicle visuals and brand logos
Data Table → Specifications (fast charge port, body type, power, seats, towing capacity, etc.)
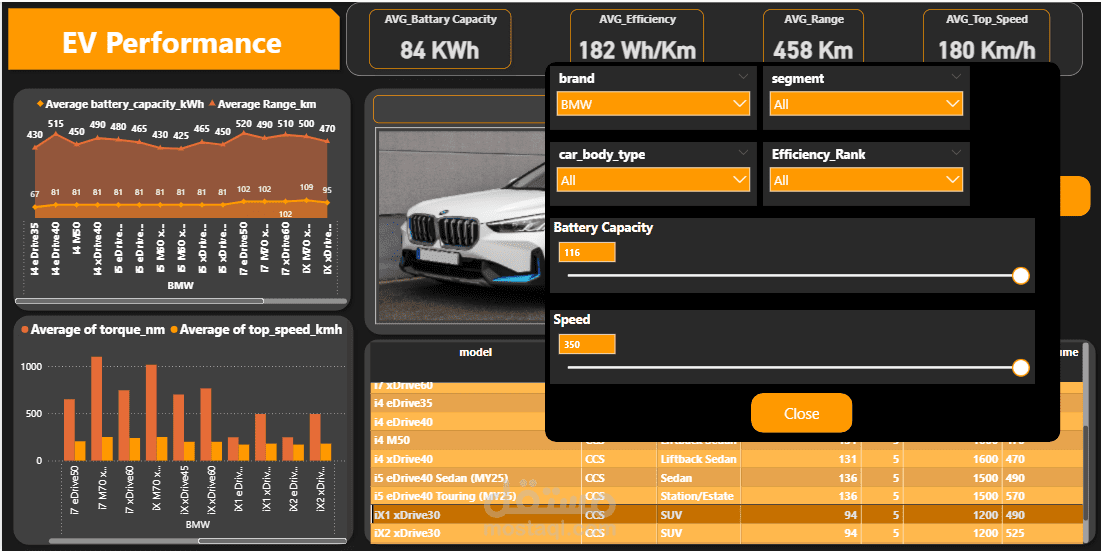
Interactive Filters
Brand | Segment | Body Type | Efficiency Rank
Numeric sliders for Battery Capacity & Speed
Custom filter panel using bookmarks for better UX
? Analytical Insights
? Battery vs. Range Correlation:
Higher battery capacity (>90 kWh) strongly correlates with extended range, reflecting improvements in energy density.
? Efficiency Clusters:
Three distinct efficiency groups appeared: High (<180 Wh/km), Mid (180–200), and Low (>200).
? Performance Leaders:
Tesla and Audi models showed high top speed and efficiency balance.
SUVs consumed more power but offered better torque and capacity.
? Design Trade-Offs:
Vehicles optimized for speed and torque often show lower efficiency—a key insight for design optimization.