تحليل بيانات المبيعات / Sales data analysis
تفاصيل العمل
I successfully analyzed sales data for Threads Ltd to provide actionable insights for the Sales team.
Through this project, I :
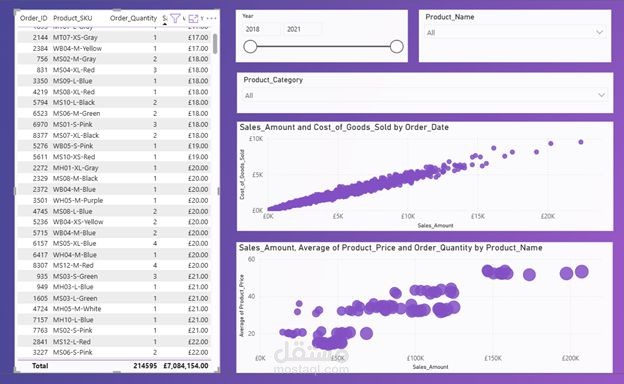
•Built an interactive orders table with dynamic filters for Year and Product Name.
•Created a Scatter Plot to explore the relationship between Sales Amount and COGS.
•Developed a Bubble Chart visualizing Total Sales, Average Product Price, and Order Quantity to support product strategy decisions.
This project enhanced my ability to transform raw data into clear, actionable insights using Power BI.