Key Performance Indicators
تفاصيل العمل
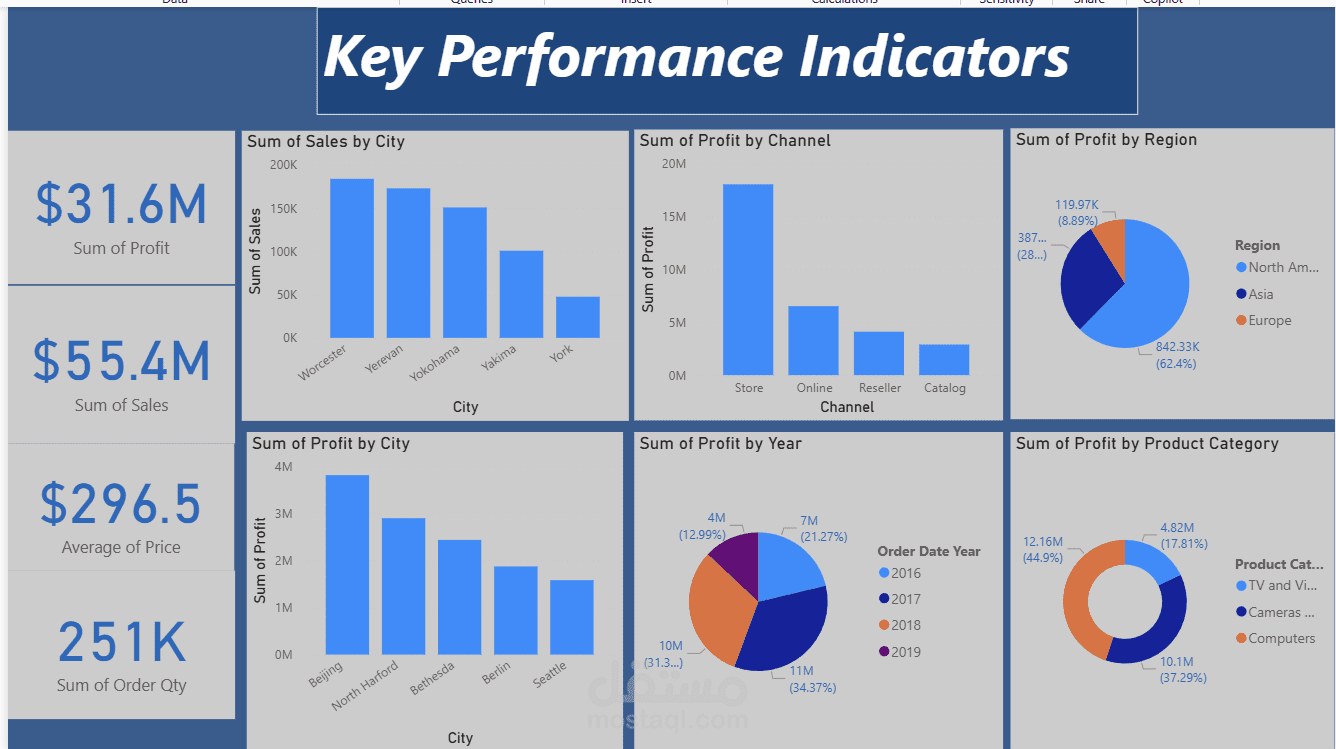
Key Insights from the Dashboard
Overall Performance
Total Sales: $55.4M
Total Profit: $31.6M
Average Price: $296.5
Total Orders: 251K
> The business shows strong profitability, with profit representing a significant portion of
total sales — indicating efficient cost control or healthy margins. ---
Sales by City
Top-performing cities in Sales appear to be:
Vancouver
Waterloo
York
Cities with lower sales:
Victoria
Elora
> Sales are concentrated mainly in a few key cities, suggesting potential expansion
opportunities in lower-performing areas. ---
Profit by Region
Pie chart shows:
United States dominates profit share (≈ 66%)
Europe contributes a smaller portion (≈ 19%)
South America has the lowest share (≈ 14%)
> The U.S. is the core profit driver, while South America may need marketing push, better
pricing strategy, or cost optimization. ---
Profit by Product Category
Top profit categories:
TV & Video: Highest profit
Computers: Second highest
Cameras & Office Supplies: Lowest
> Profit is heavily dependent on a few categories (TV, Video, Computers).
Product diversification or improvement in low-profit categories could balance revenue. ---
Profit by Channel
Channels performance:
Store Channel is the most profitable (≈ $15M)
Online Channel is second
Reseller & Catalog have significantly lower profit
> Physical stores are driving most of the profit, while reseller and catalog channels may
need strategy revamp. ---
Quick Actionable Business Recommendations
1. Strengthen Weak Regions
Focus marketing and inventory optimization in South America & Europe.
2. Boost Low-Profit Product Categories
Revisit pricing, promotions, and margins for Cameras & Office Supplies.
3. Channel Optimization
Explore why Reseller and Catalog underperform — maybe distribution cost, discounts, or
weak partners.
4. City-Level Opportunities
Grow presence in Victoria & Elora through targeted campaigns.