Customer Churn Intelligence Dashboard (Power BI)
تفاصيل العمل

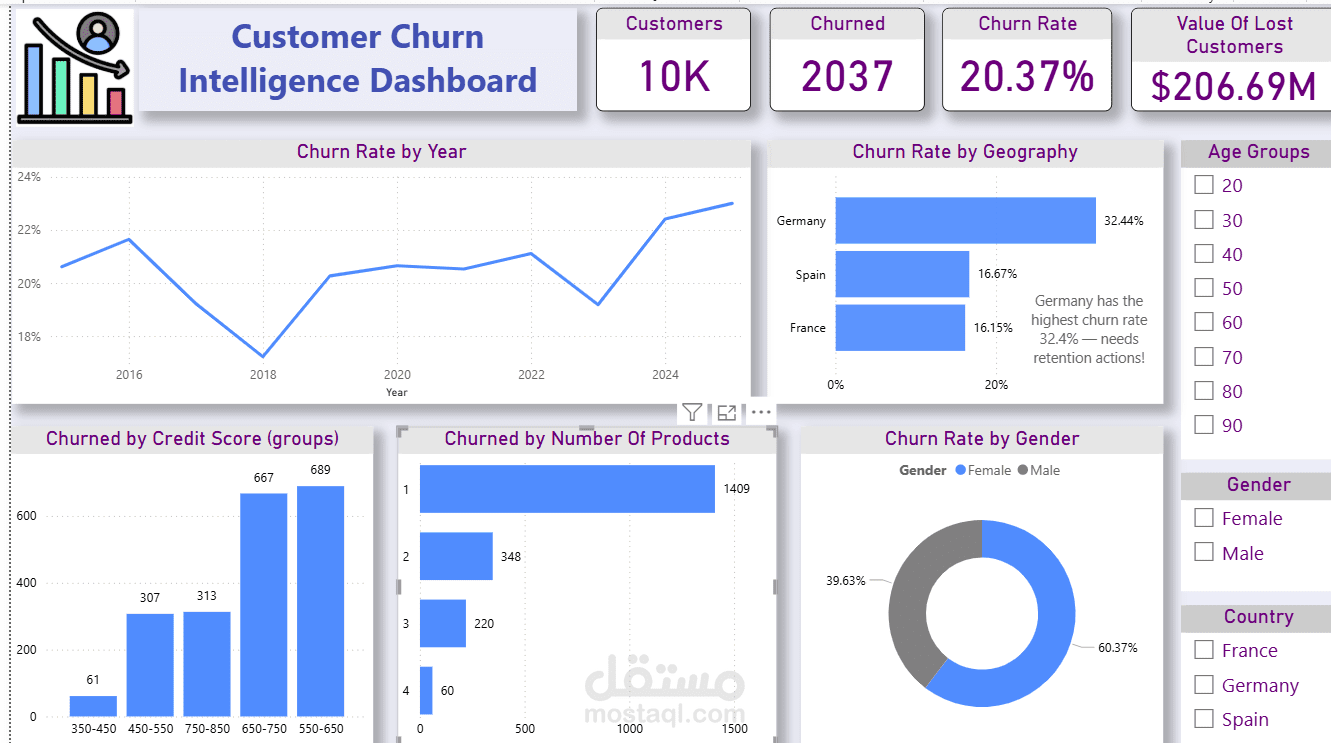
This dashboard analyzes customer churn behavior and identifies main churn drivers, high-risk customer segments, and potential retention actions.
Key Metrics
Total Customers: 10,000
Churned Customers: 2,037
Churn Rate: 20.37%
Value of Lost Customers: $206.69M
Main Insights
Germany has the highest churn rate (32.4%) → requires urgent retention strategies
Highest churn volume comes from customers with 2 products
Customers within 550–650 credit score groups show high churn count
Female customers churn more than male customers (60% vs 40%)
Visuals Included
Churn Rate by Year
Churn by Geography (Country)
Churn by Credit Score Group
Churn by Number of Products
Churn Rate by Gender
Slicers for Age Group, Gender, and Country
Tools Used
Microsoft Power BI
Power Query
DAX
Data Modeling
Data Visualization Design Principles
Purpose of the Project
The aim of this analysis is to support customer retention planning, reduce churn-related losses, and improve customer lifetime value.
This dashboard can help decision-makers understand which segments are most vulnerable and where to focus retention campaigns.