Sales Transactions Dashboard (Power BI)
تفاصيل العمل
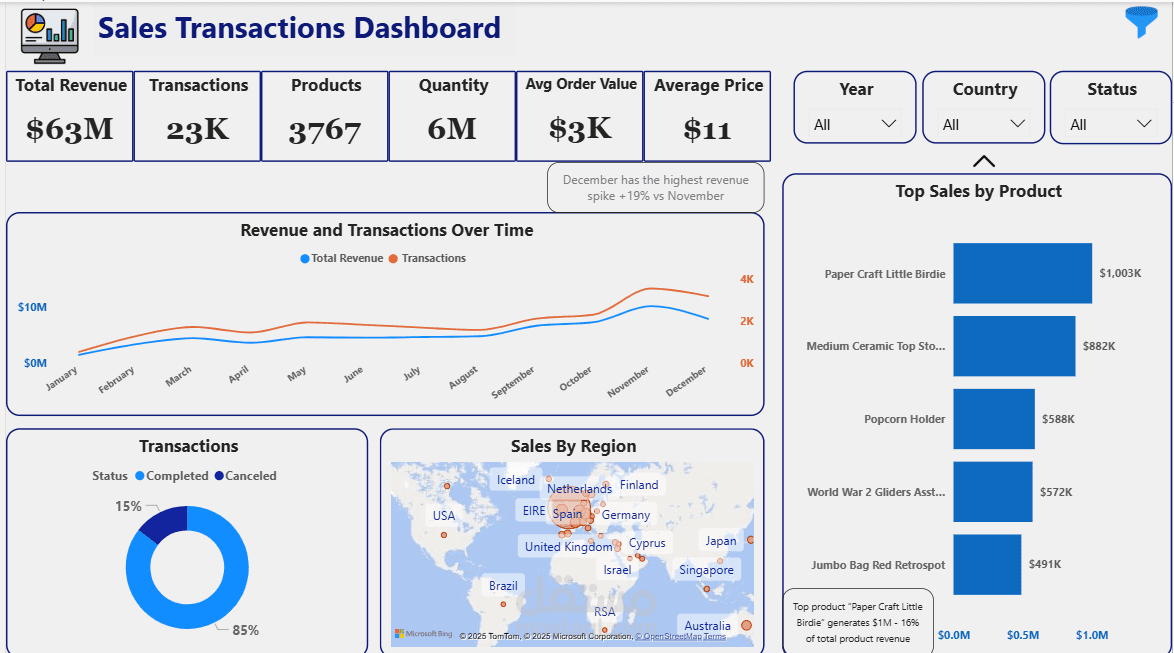
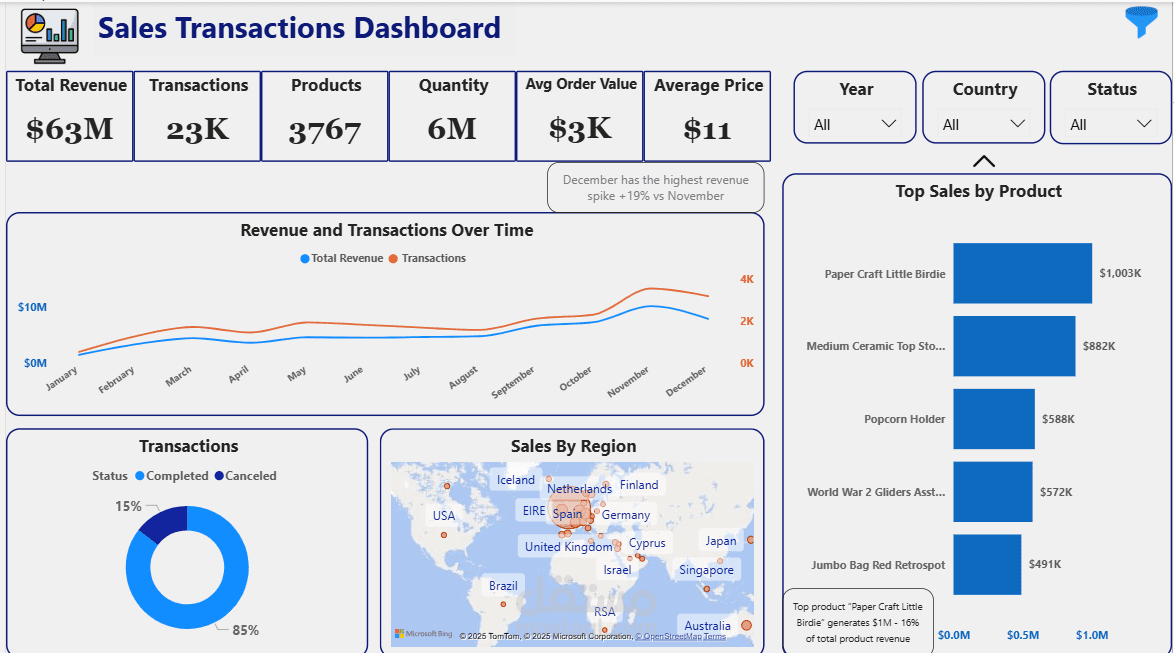
This dashboard analyzes multi-region sales performance with insights on:
Total revenue ($63M)
Transactions (23K)
Top selling products
Monthly revenue trends
Regional performance
Key Insights
December has the highest revenue spike (+19% vs November)
Top product: Paper Craft Little Birdie ($1.0M) – representing 16% of product revenue
85% of all transactions are completed successfully
Tools Used
Power BI
DAX
Power Query
Data Modeling