Machine Learning
تفاصيل العمل
Medical Insurance Cost Prediction (Linear Models)
This Jupyter Notebook demonstrates a machine learning project for predicting medical insurance costs using various regression models, focusing on linear and tree-based approaches.
Overview
Dataset: The project uses the insurance.csv dataset, which includes features like age, sex, BMI, number of children, smoking status, region, and insurance charges (target variable).
Goal: Build and evaluate models to predict insurance charges based on patient attributes.
Key Steps:
Data Loading & EDA: Load data into a Pandas DataFrame, perform summary statistics, check for missing values, unique values in categorical columns, and visualize distributions/outliers.
Preprocessing: Handle categorical variables (e.g., via OneHotEncoder), scale numerical features, and apply transformations (e.g., log for charges if needed).
Model Training & Evaluation:
Train linear models (e.g., Linear Regression, Polynomial Features).
Train tree-based models (Random Forest, XGBoost, LightGBM) with hyperparameter tuning using GridSearchCV and KFold cross-validation.
Evaluate using R² score and Mean Squared Error (MSE).
Feature Selection & Analysis: Use techniques like SelectFromModel for important features.
Residual Analysis: For the best tree-based model, generate residual plots via cross-validation predictions to assess model fit.
Models Compared: Linear Regression, Random Forest, XGBoost, LightGBM.
Best Model Determination: The notebook identifies the best model (e.g., Random Forest, XGBoost, or LightGBM) based on cross-validation metrics and visualizes residuals if it's tree-based.
Requirements
Python 3.x
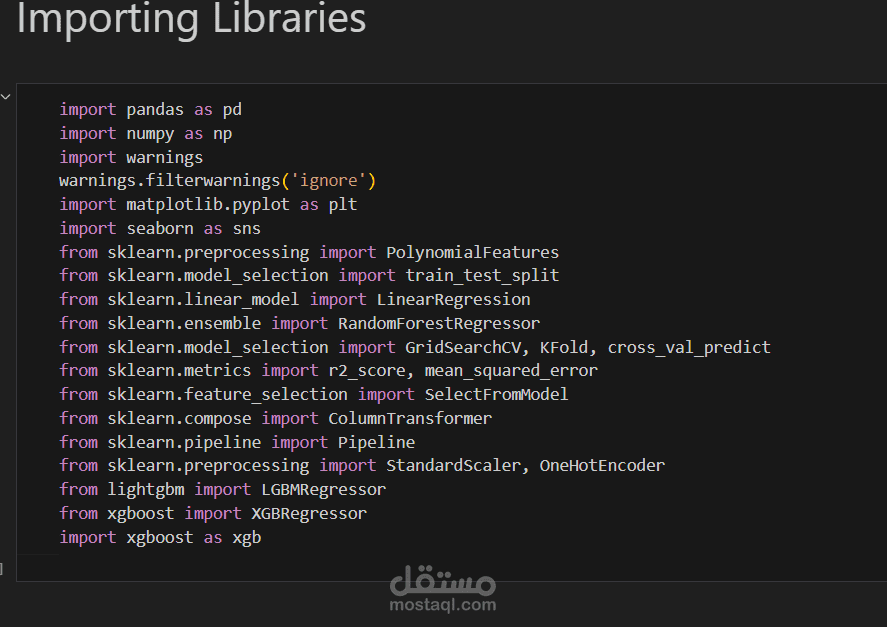
Libraries: pandas, numpy, matplotlib, seaborn, scikit-learn (for models, preprocessing, metrics), xgboost, lightgbm.
Install via: pip install -r requirements.txt (create one if needed, listing the imports).
Usage
Clone the repository: git clone <repo-url>
Open the notebook: jupyter notebook Medical_Insurance_Cost_Prediction_(Linear_Models_).ipynb
Run cells sequentially to load data, perform EDA, train models, and view results.
Ensure insurance.csv is in the same directory.
Results
Cross-validation metrics (R² and MSE) are printed for each model.
Residual plots help identify patterns or biases in predictions.
Example Output: If the best model is tree-based, it displays R²/MSE and a scatter plot of predicted vs. residuals.