Churn Dashboard
تفاصيل العمل
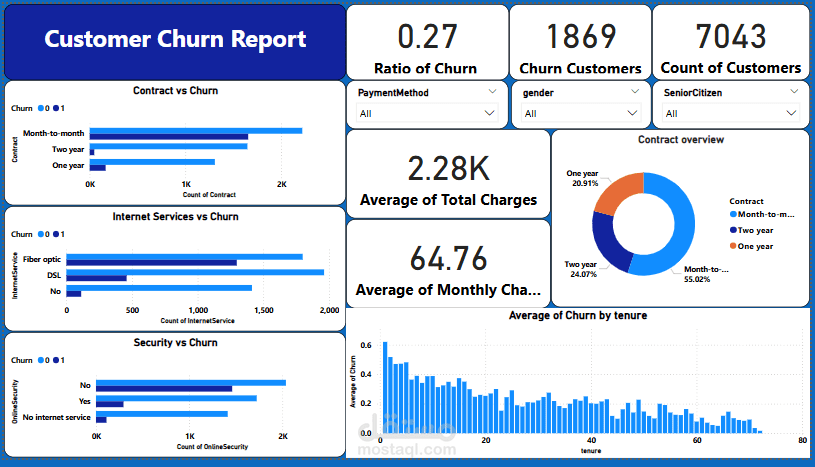
Customer Churn Report – Dashboard Description
This dashboard provides a comprehensive analysis of customer churn, identifying key factors contributing to customer attrition and highlighting trends that help businesses improve retention strategies.
1. Key Metrics Overview
At the top of the dashboard, the main KPIs summarize churn performance:
Churn Ratio: 0.27
Churn Customers: 1,869
Total Customers: 7,043
Average Total Charges: 2.28K
Average Monthly Charges: 64.76
These indicators give a high-level understanding of current churn levels and customer spending behavior.
2. Contract vs Churn
This bar chart shows how churn varies across different contract types:
Month-to-Month customers have the highest churn rate.
One-year and Two-year contracts experience significantly lower churn.
This reveals that long-term commitments reduce churn.
3. Internet Services vs Churn
The chart compares churn across various internet service types:
Customers using Fiber Optic show the highest churn rates.
DSL customers churn less.
This insight helps prioritize service quality improvements.
4. Security vs Churn
This section examines the relationship between online security services and churn:
Customers without internet security show a higher churn rate.
Offering security services may help enhance retention.
5. Contract Overview (Donut Chart)
This visualization displays the distribution of customers by contract type:
Month-to-month: 55%
Two year: 24%
One year: 20%
A high percentage of short-term contracts explains the overall churn problem.
6. Churn by Tenure
The bar chart shows how churn varies with customer tenure:
New customers (0–10 months) have the highest probability of churning.
Churn decreases significantly as tenure increases.
This indicates the importance of improving onboarding and early customer engagement.
7. Interactive Filters
Users can dynamically filter results by:
Payment Method
Gender
Senior Citizen
This enables deeper exploration of churn behavior across demographic and payment segments.
Overall Insight
The dashboard effectively highlights the major drivers of churn, including contract type, service quality, and customer tenure. By analyzing these patterns, businesses can develop targeted retention strategies, focus on at-risk segments, and enhance customer experience to reduce churn.