Data Analysis Project – Coffee Shop Dashboard
تفاصيل العمل
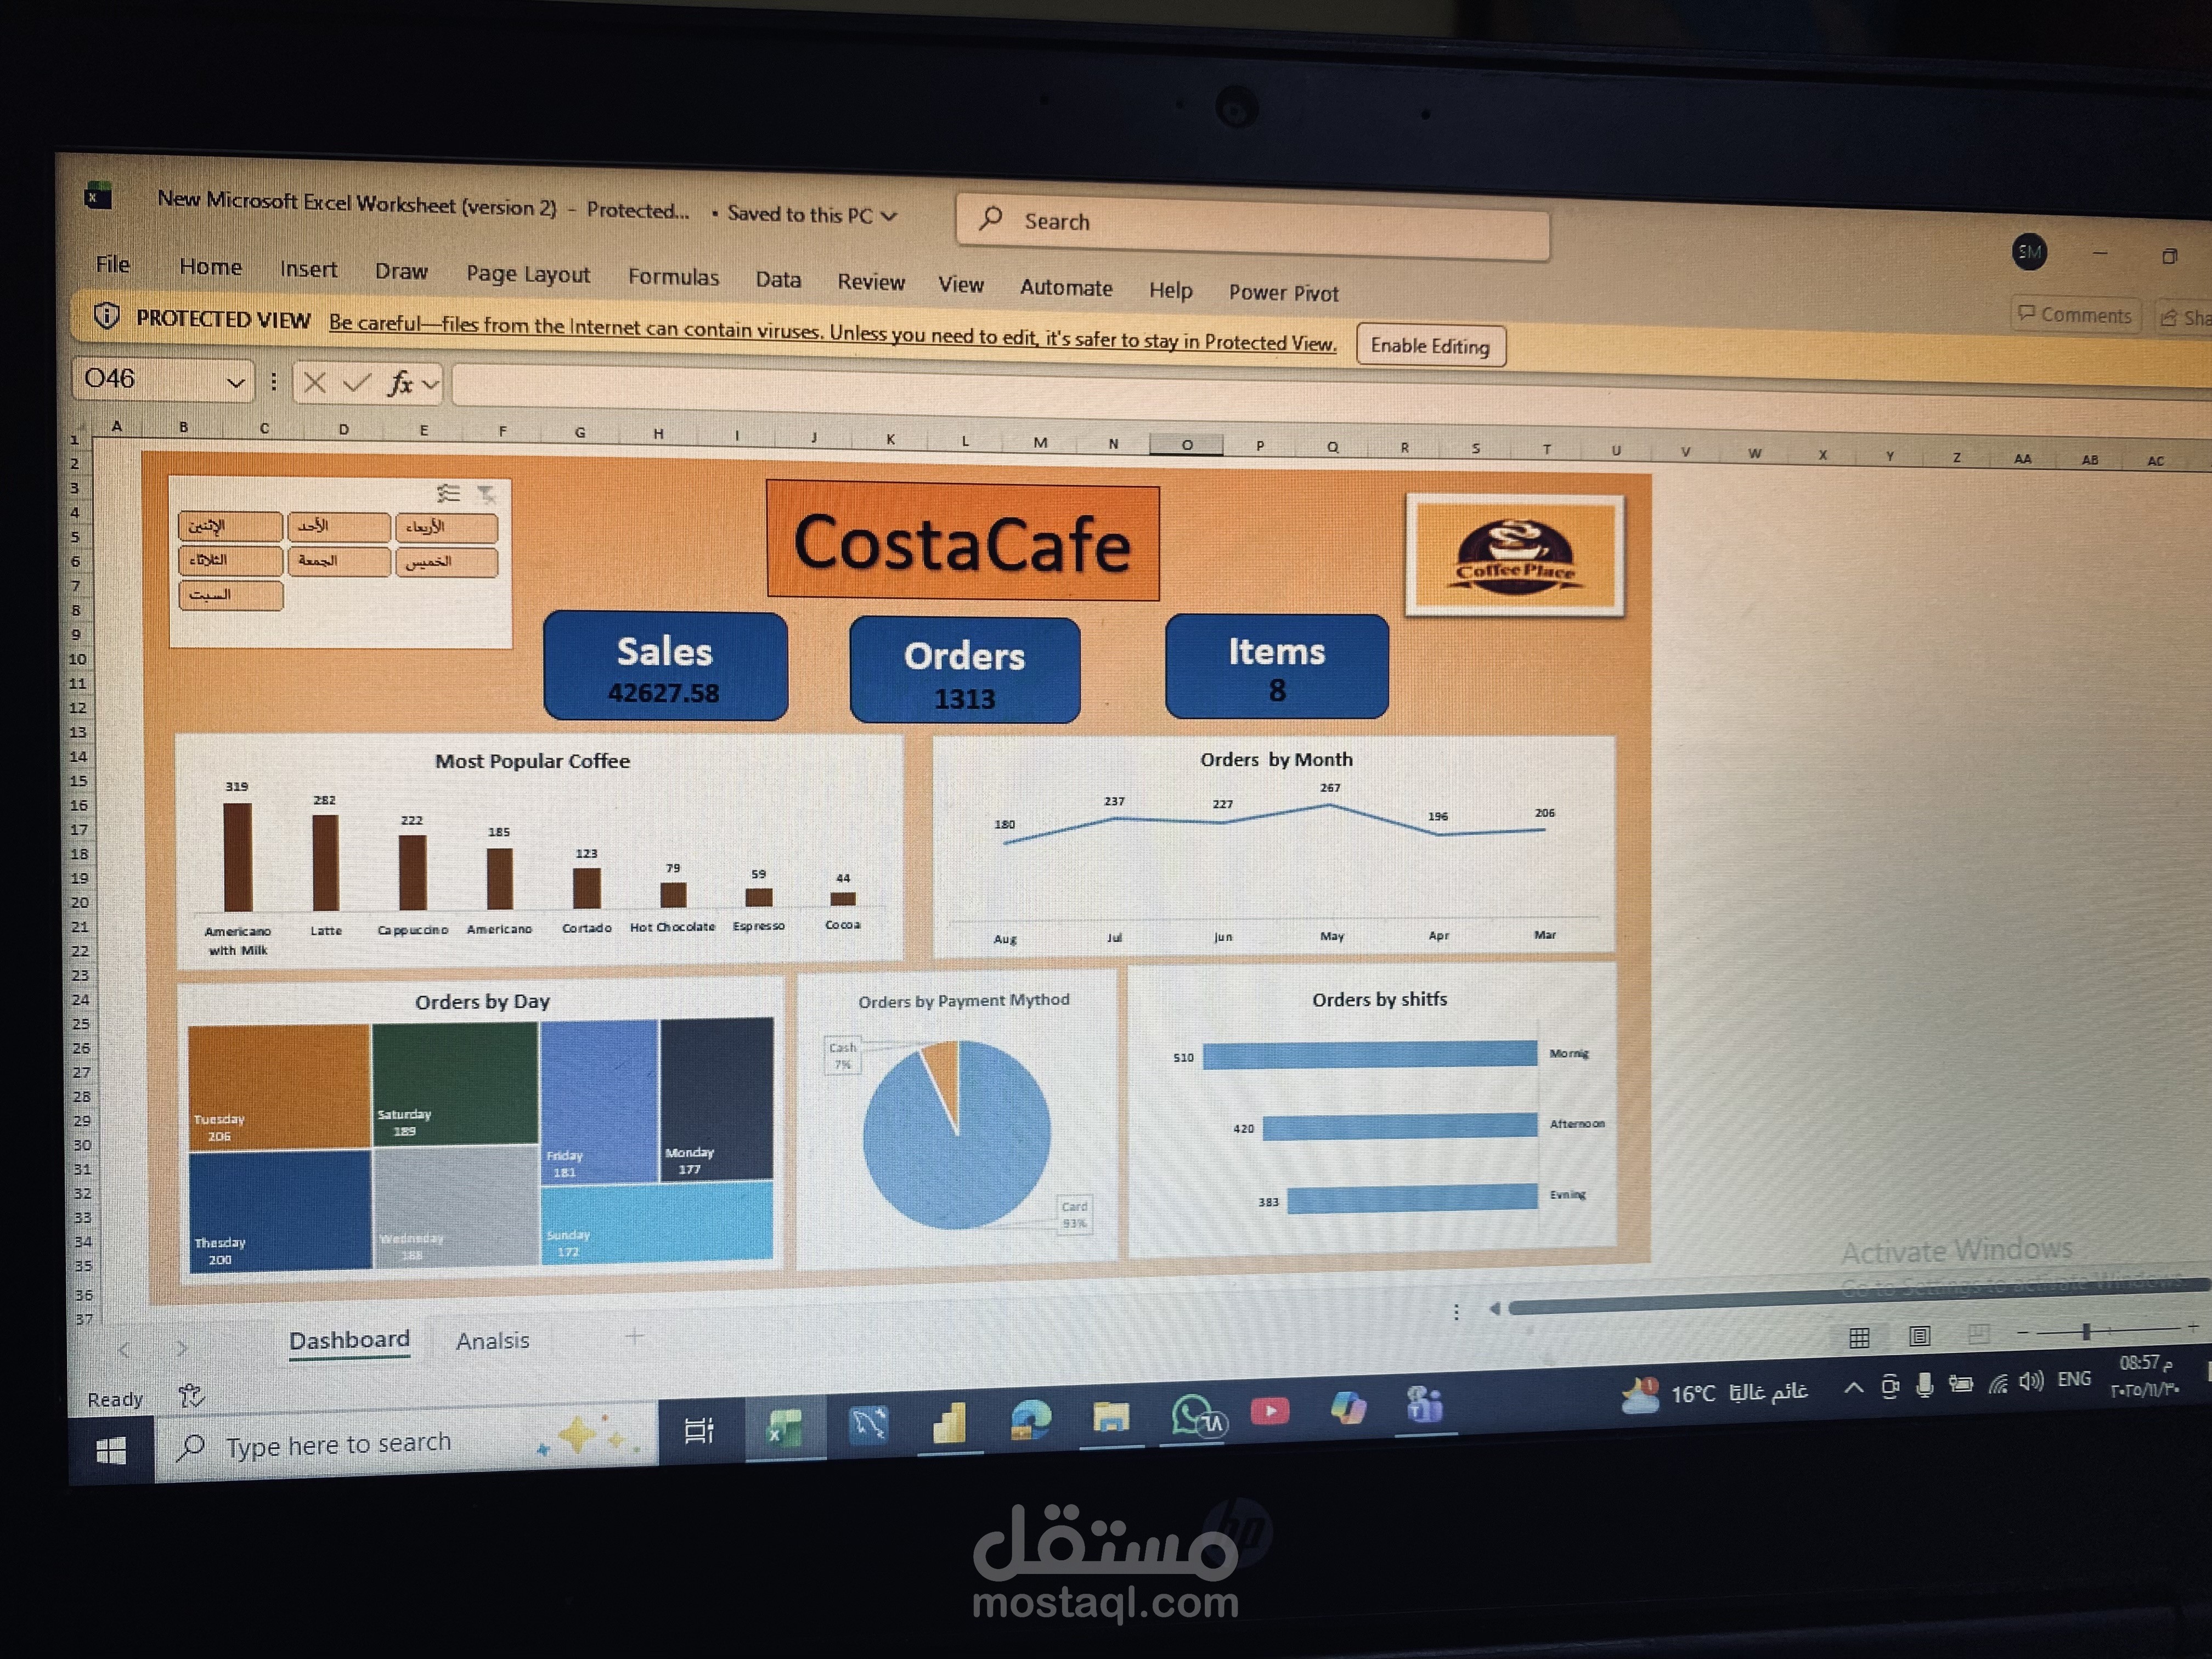

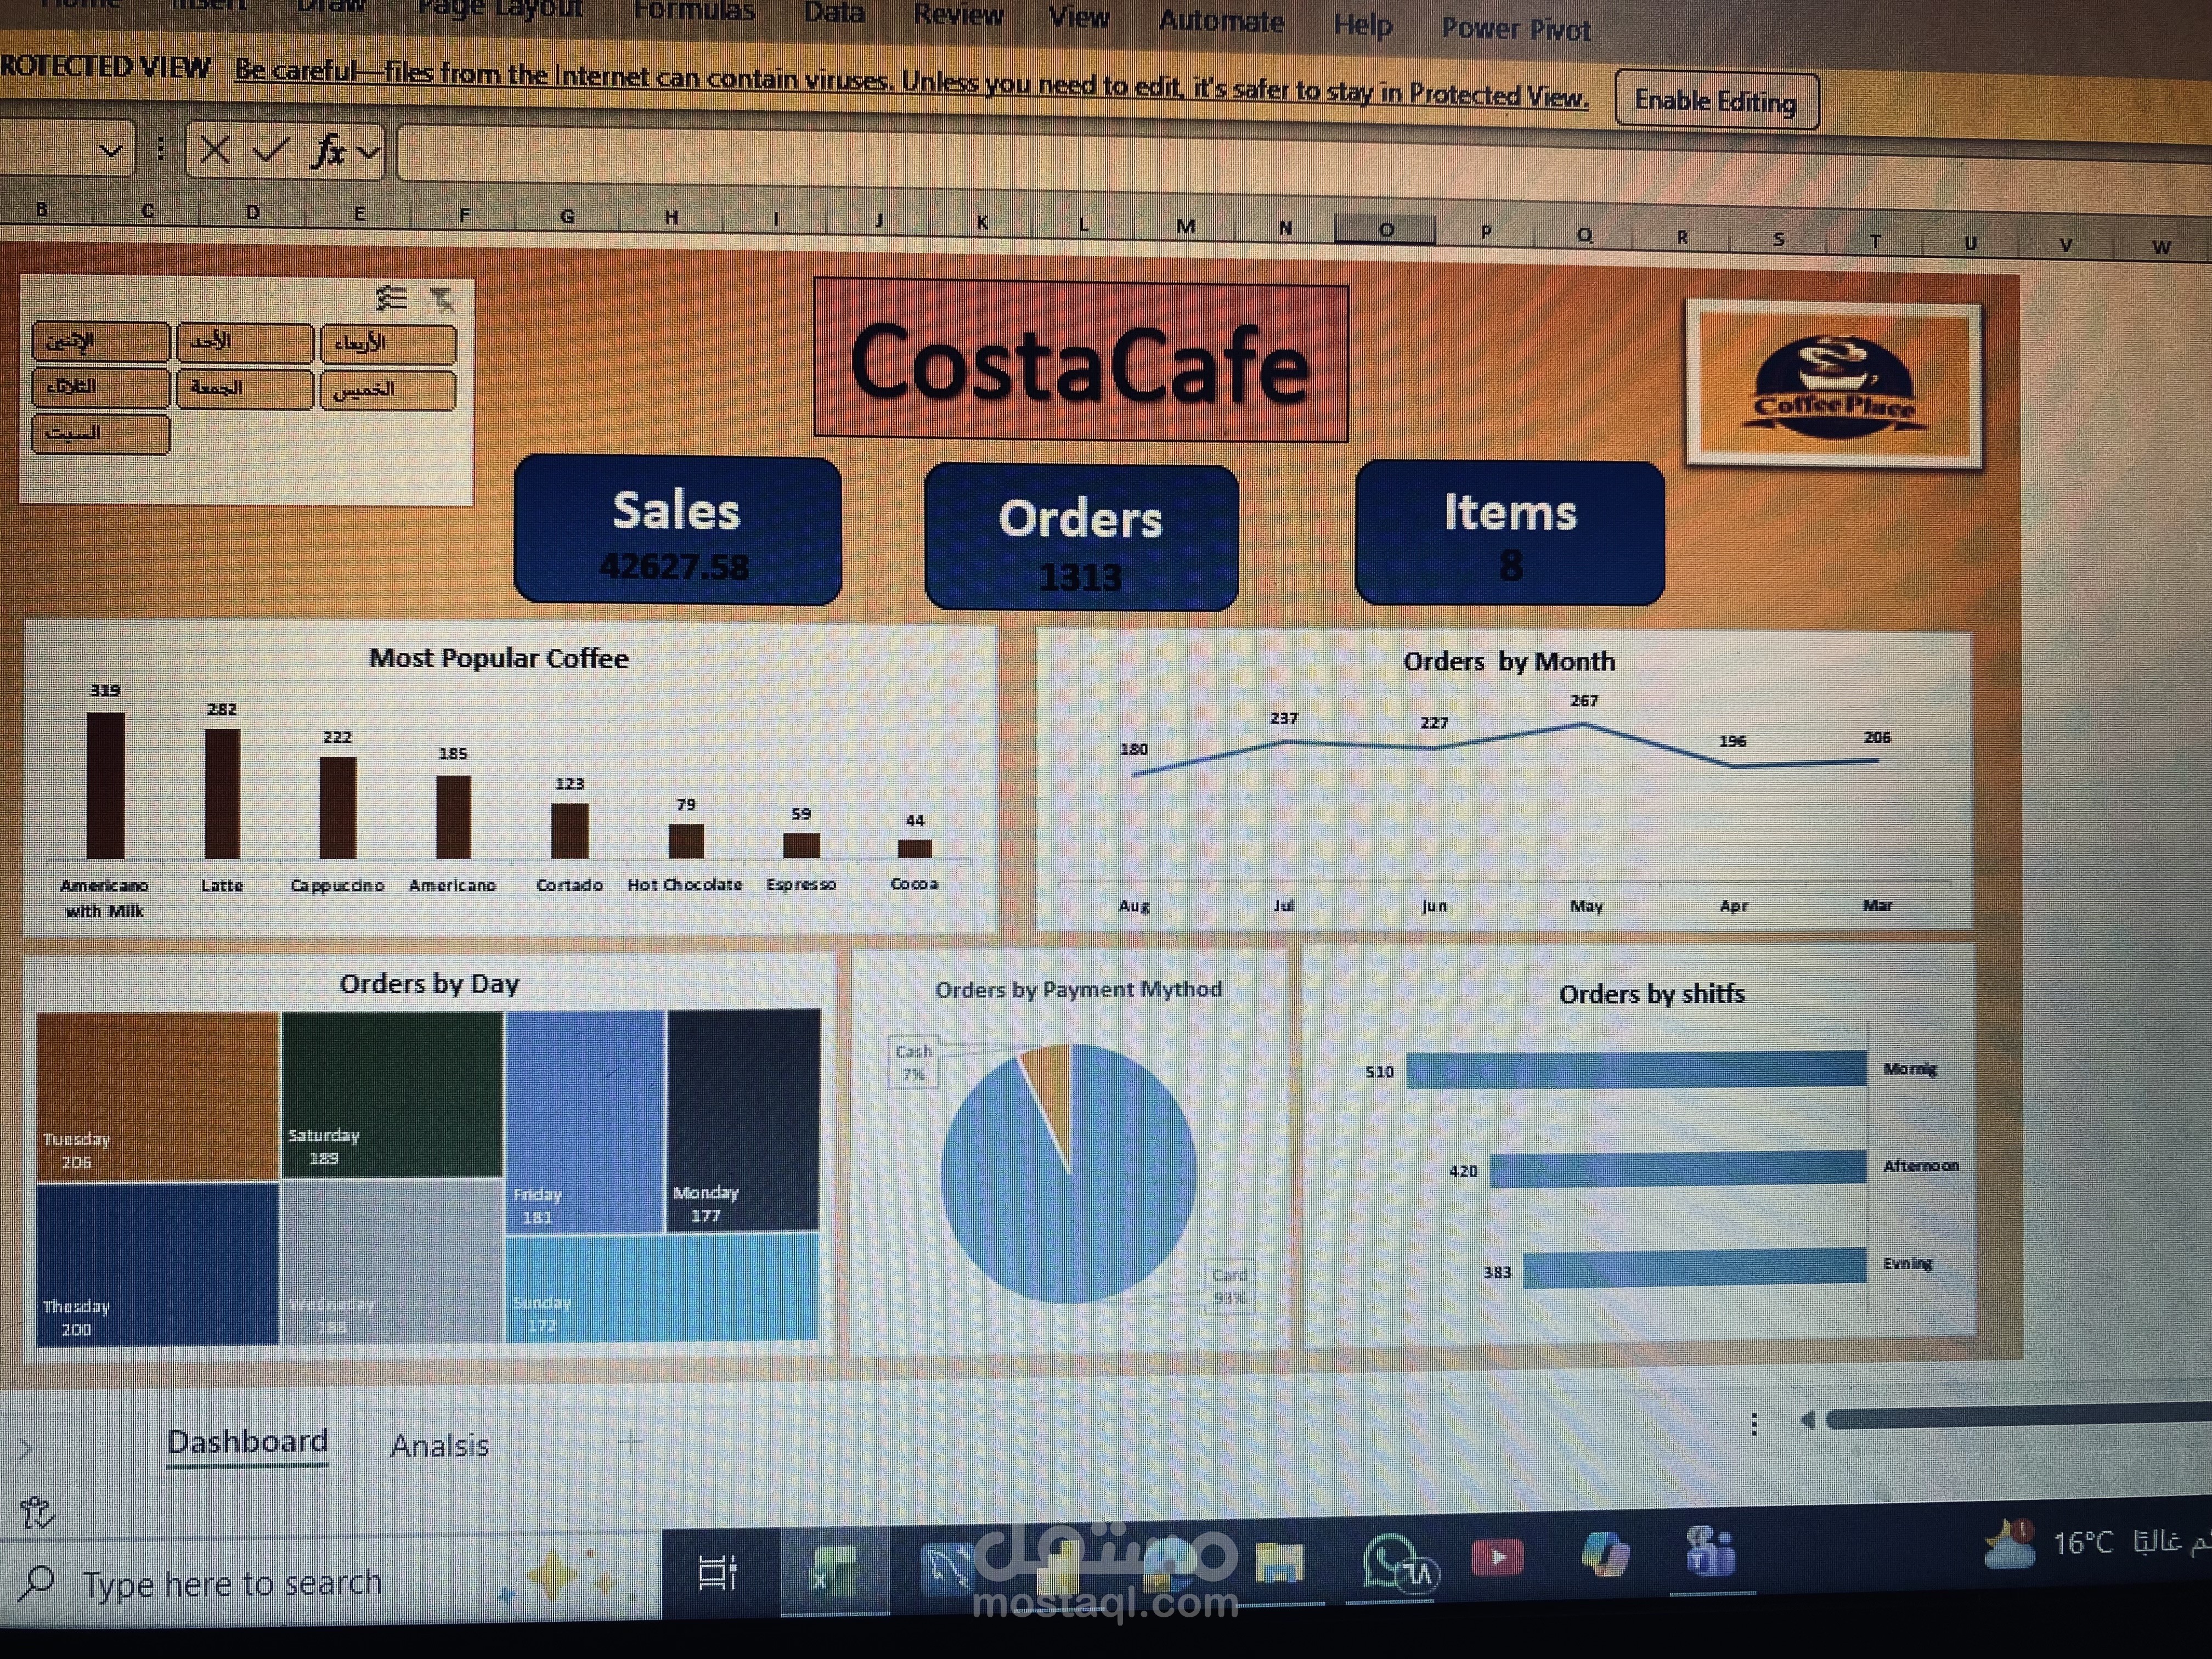
The client sent me a dataset and wanted to know
What’s the total number of orders?
What’s the total sales amount?
How many different products were sold?
Which drink is the most popular?
Which drink is the least popular?
Which month had the highest number of orders?
And which had the lowest?
Which day of the week is the busiest?
And which is the least busy?
Which shift (time of day) gets the most orders?
And which gets the least?
What’s the most used payment method?
After analyzing the data, here’s what I found:
Total orders: 1,313
Total sales: 42,627.58
Number of products: 8
Most popular drink: Americano with Milk (319 orders)
Least popular drink: Cocoa (44 orders)
Highest month for orders: May (267 orders)
Lowest month: August (180 orders)
Busiest day of the week: Tuesday (206 orders)
Least busy day: Sunday (172 orders)
Busiest time of day: Morning (510 orders)
Least busy time: Evening (383 orders)
Most used payment method: Card (93.2%) vs Cash (6.8%)