E-Commerce Data Analysis Using Python and Power BI
تفاصيل العمل
I recently completed a project where the client provided raw e-commerce data, and my role was to clean, prepare, and analyze it to deliver clear business insights.
I started by cleaning and preprocessing the dataset using Python to ensure data quality and accuracy.
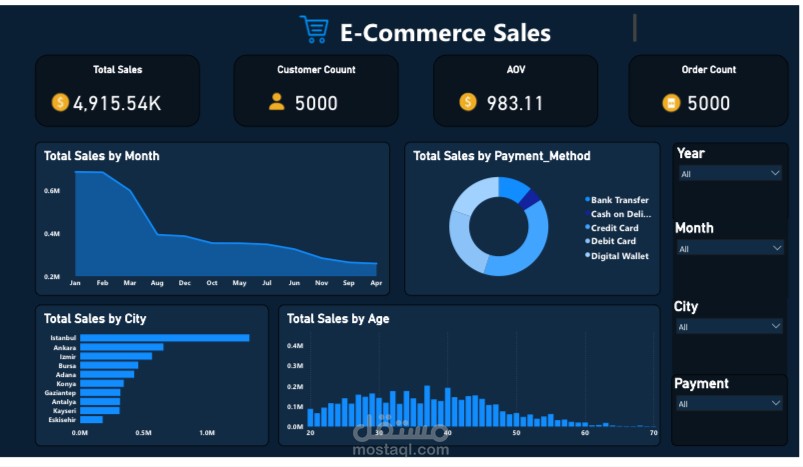
After that, I built a fully interactive Power BI dashboard that included:
• Total Sales
• Customer Count and Order Count
• Average Order Value (AOV)
• Sales by Month
• Sales by City
• Sales by Payment Method
• Sales Distribution by Age
The client had several specific questions, and the dashboard was designed to answer each one in a clear and actionable way to support better decision-making.