Data Professional Survey Breakdown – Power BI Dashboard
تفاصيل العمل
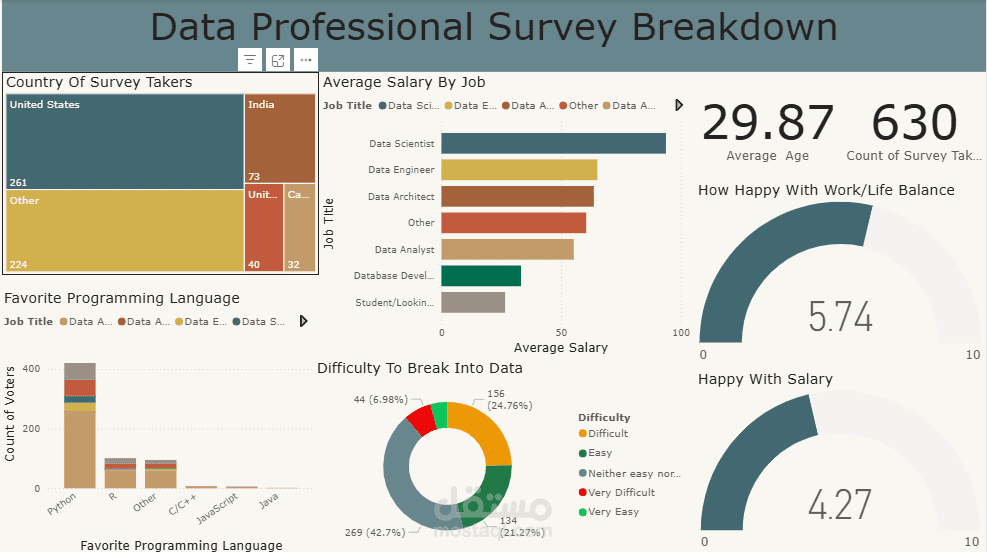

Data Professional Survey Breakdown – Power BI Dashboard
This dashboard provides a clear breakdown of insights gathered from a survey of data professionals.
It analyzes key aspects such as job roles, experience levels, salaries, preferred programming languages, and work satisfaction.
Key Highlights:
- Visual breakdown of job titles and industry roles
- Salary distribution based on experience and location
- Most used programming languages and tools
- Work-life balance and job satisfaction insights
- Interactive filters for exploring demographics and trends
This dashboard helps understand the overall landscape of the data profession and highlights valuable trends in- the field.