Walmart Branch Performance Analysis using Power BI
تفاصيل العمل

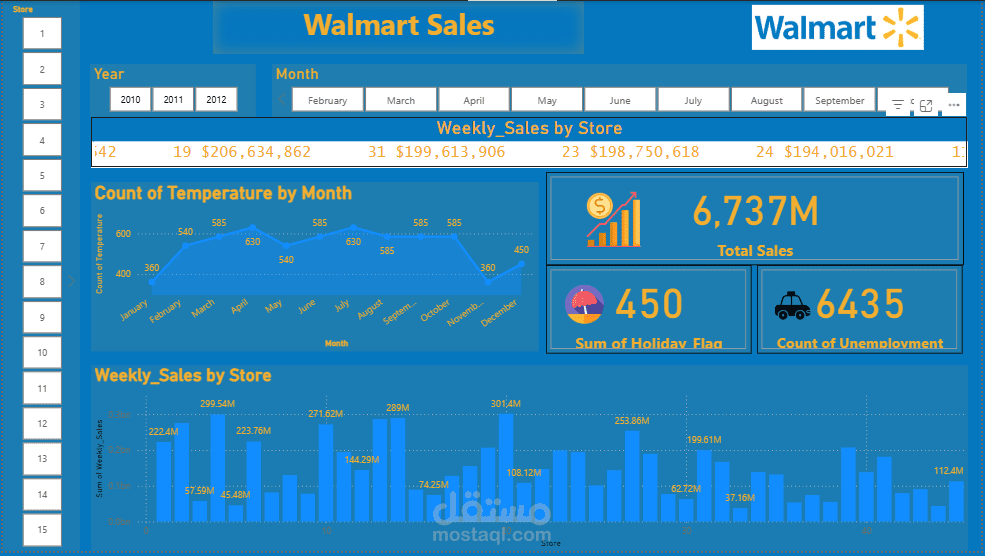
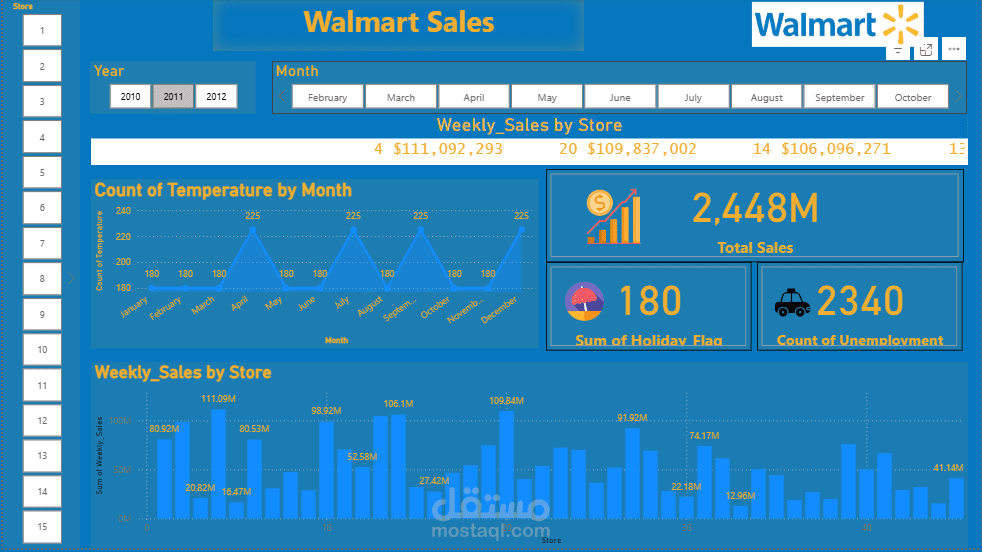
Power BI Dashboard – Walmart Branch Performance Analysis
Built an interactive Power BI dashboard to analyze and monitor the performance of Walmart branches across different regions.
Key Highlights:
• Dynamic filters to explore each branch’s KPIs
• Monthly and yearly performance comparison
• KPIs for revenue, sales growth, and employee count
• Clean, interactive layout for fast and clear insights