Interactive Sales & Expenses Dashboard with PivotTables & Slicers
تفاصيل العمل
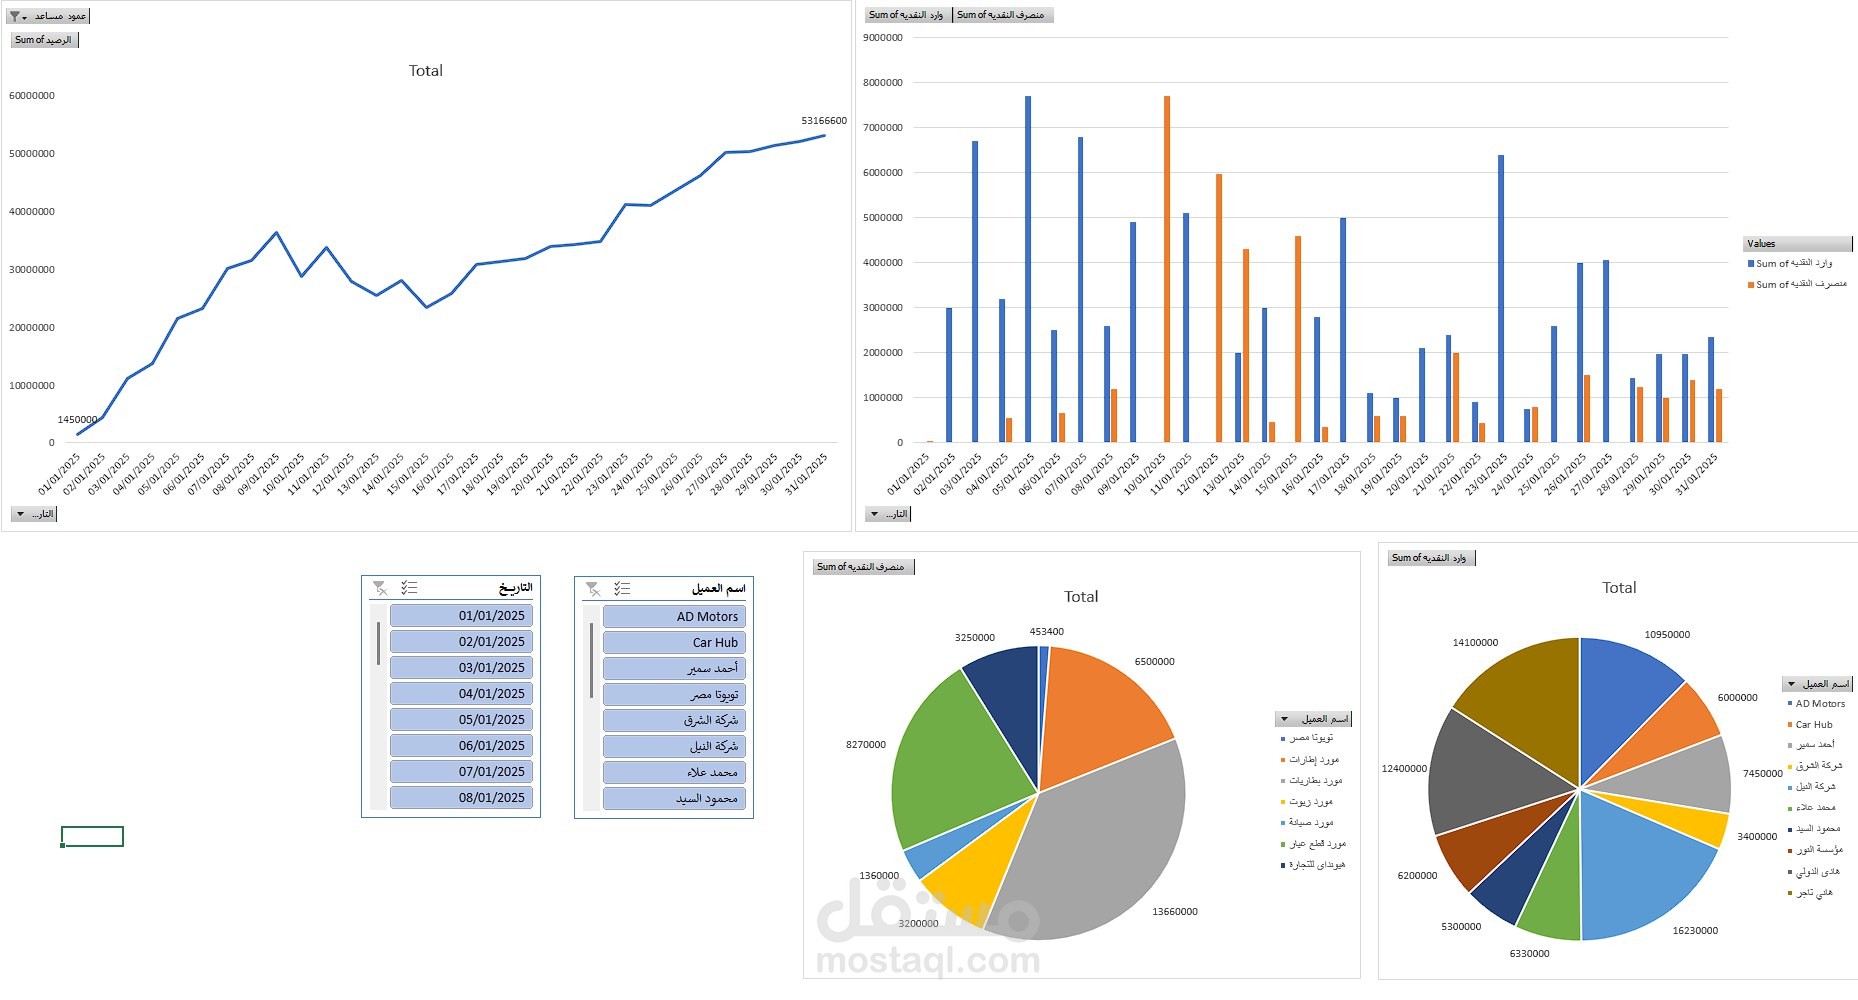
Created a full interactive Excel dashboard combining both sales and expenses data.
I organized all data by date and customer, then built separate PivotTables for each section (sales, expenses, totals).
After that, I designed multiple charts for visual reporting and combined everything into one clean, integrated dashboard.
Slicers were added to make the dashboard fully interactive, allowing instant filtering by date, customer name, and transaction type.
This dashboard makes it extremely easy to track, analyze, and monitor any data point with one click.