Professional Sales & Expenses Tracker with Daily/Monthly Reports
تفاصيل العمل
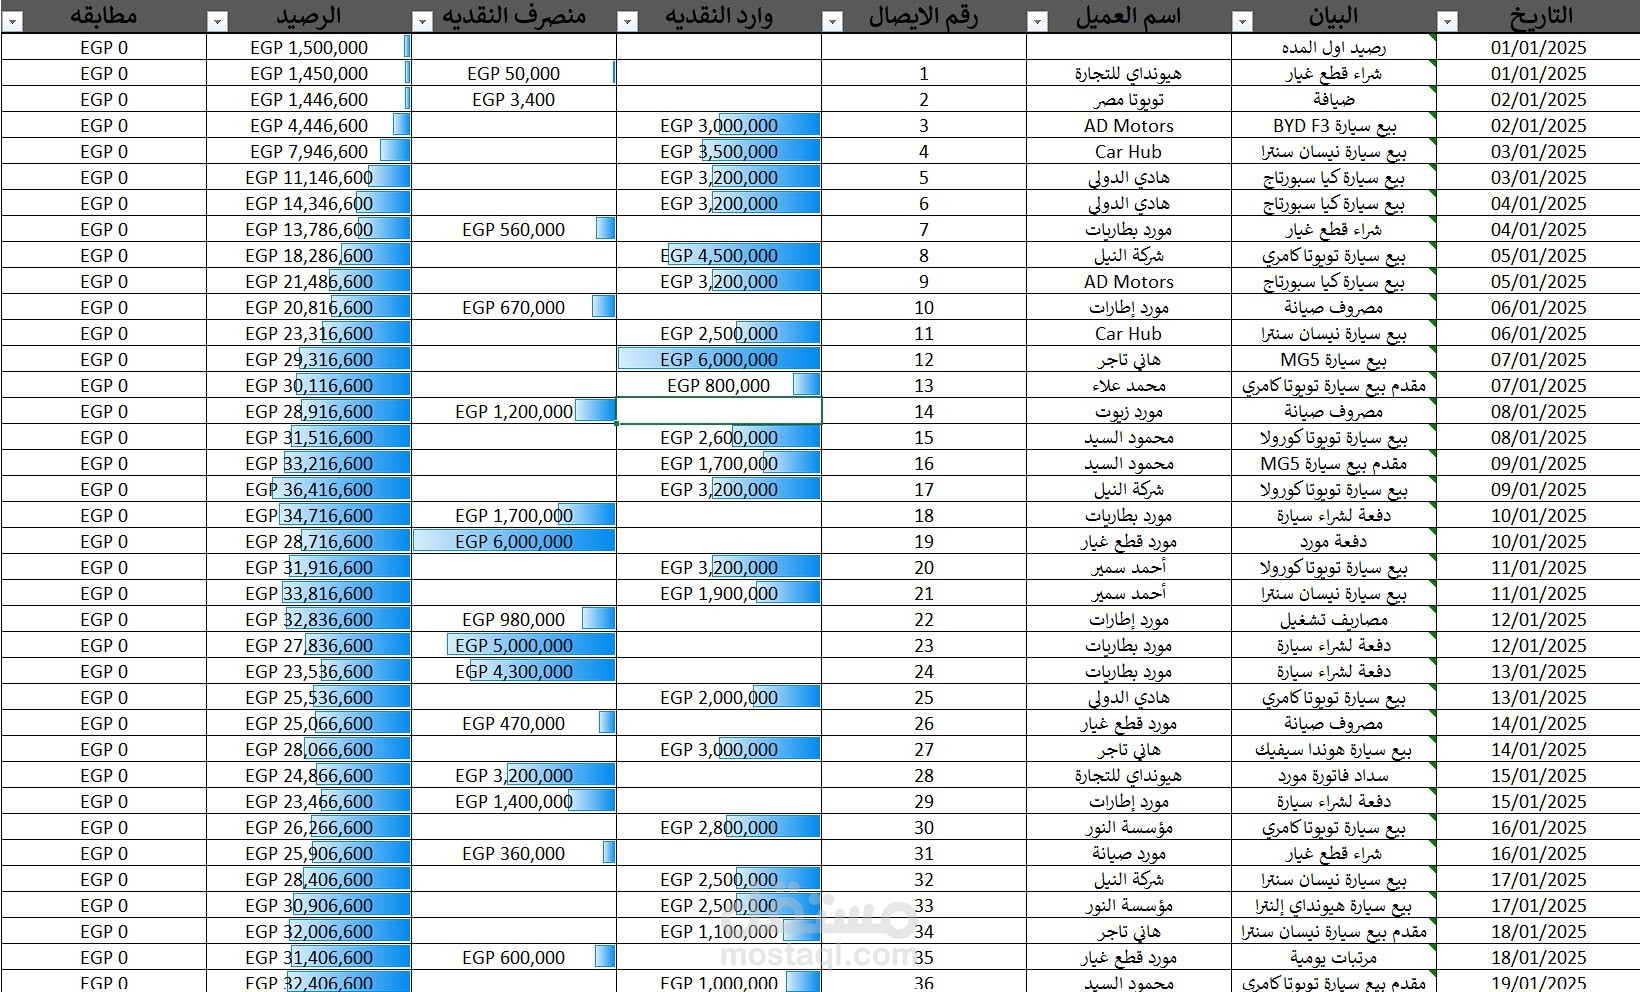
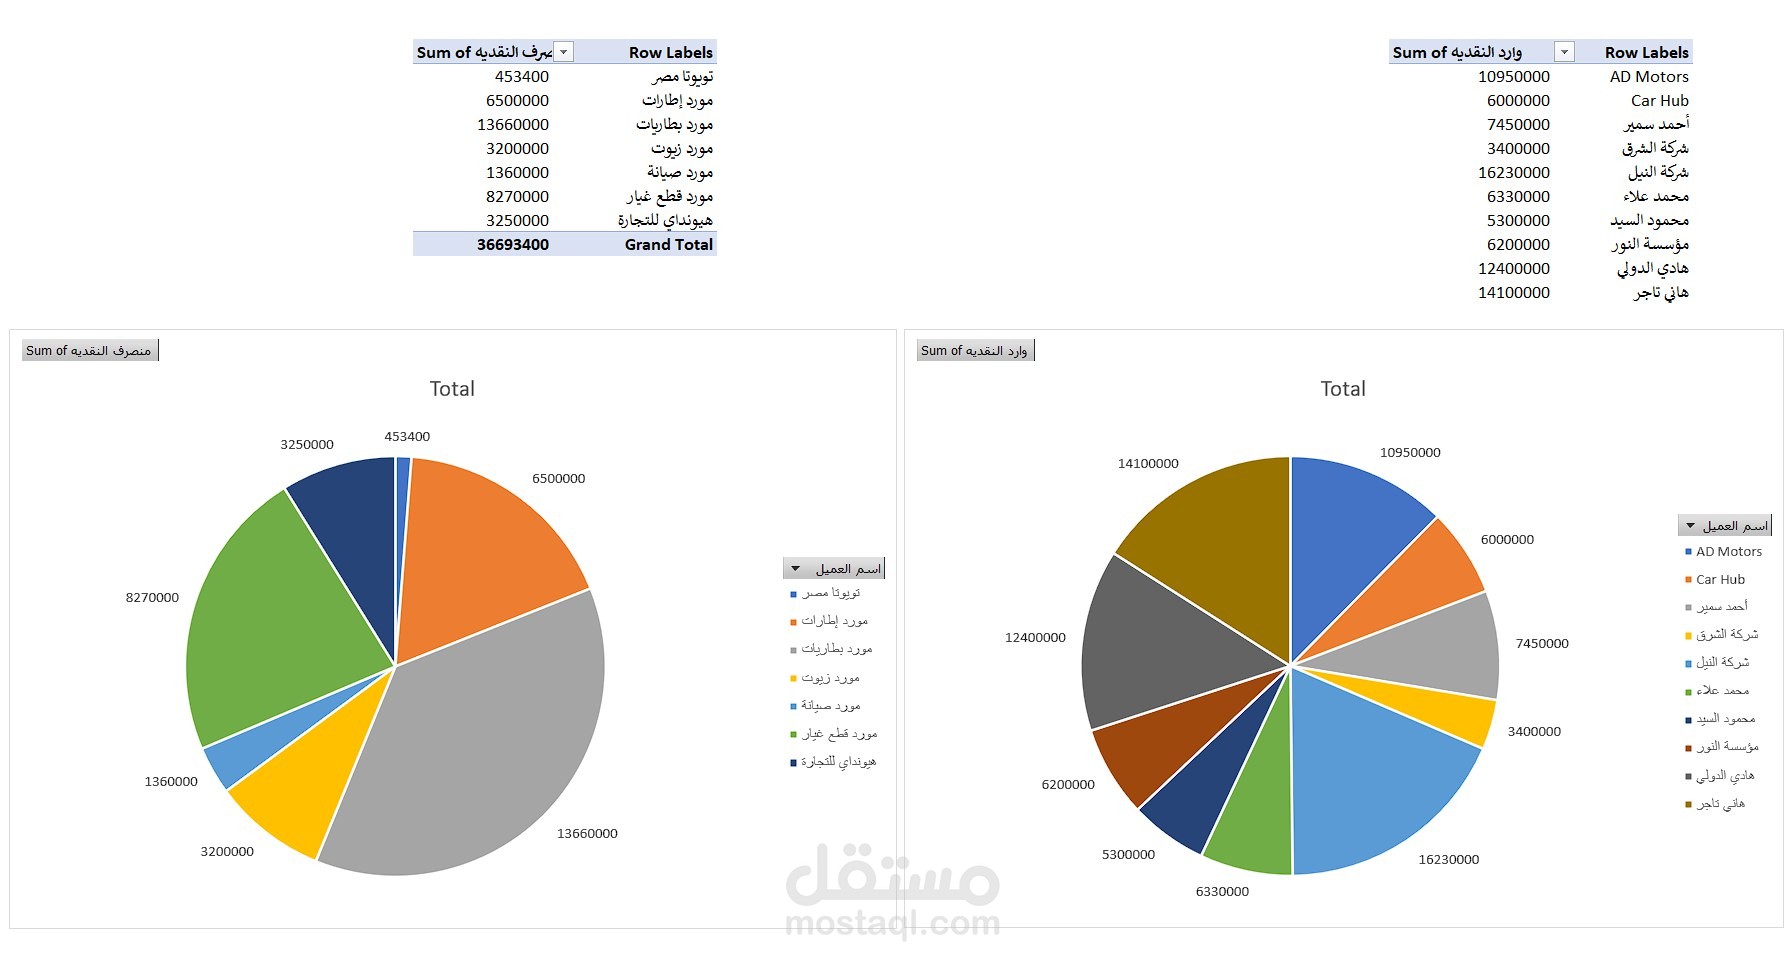
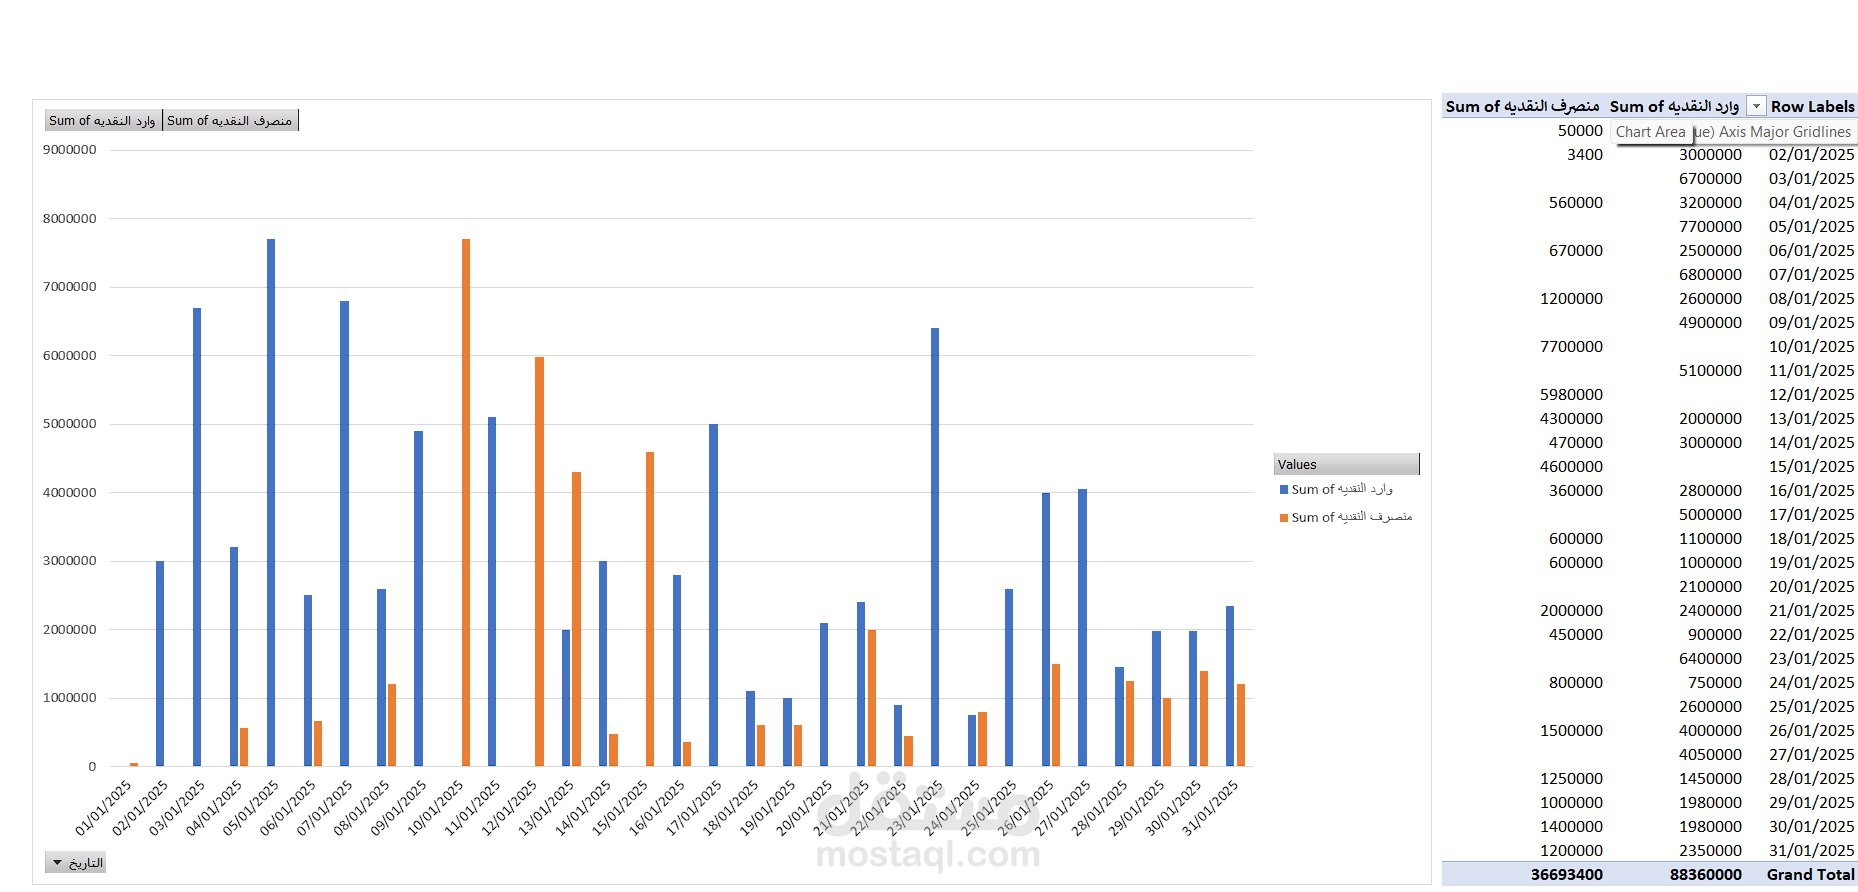
This sheet is only a small sample of a much larger Excel project I created.
The original file contains a large dataset with many more rows and detailed financial records.
I prepared daily and monthly reports based on the data, in addition to creating a clean and professional dashboard that summarizes the key metrics clearly.
The full project includes:
Organized tables for sales, expenses, and transactions
Conditional formatting for better visualization
Daily totals and monthly summaries
A simple dashboard using PivotTables, charts, and slicers
Easy-to-read layout and clean formatting for reporting
This sample demonstrates my ability to organize large datasets, clean data, build structured tables, and turn raw numbers into meaningful insights and visual reports.