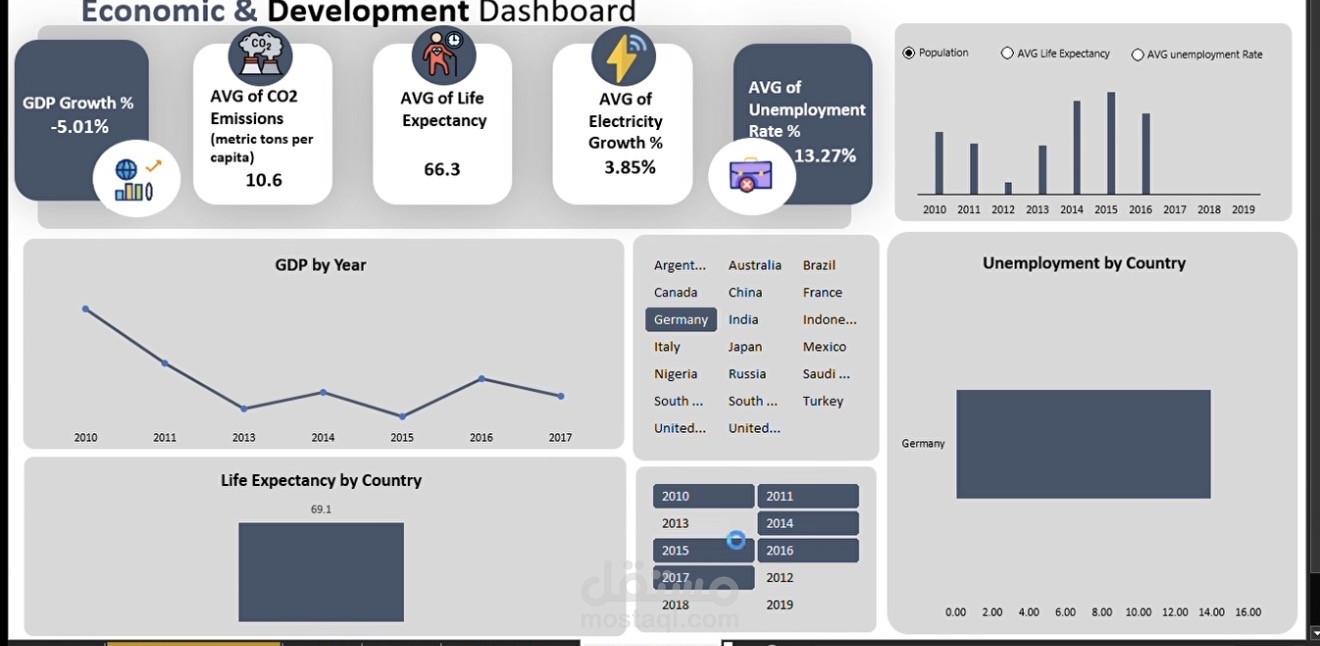
Finished building an Economic & Development Dashboard in Excel
تفاصيل العمل
وضح نوع العمل، ميزاته وطريقة تنفيذه.
صور وملفات العمل
اسحب الملفات إلى هنا
أو انقر للاختيار يدويا
أضف صور أو ملفات بحد أقصى 20 مرفق.
رابط المعاينة
(اختياري) رابط للعمل الذي قمت بتنفيذه مثال: رابط موقع، فيديو من YouTube أو Vimeo
تاريخ الإنجاز
المهارات
حدد المهارات والادوات التي استخدمتها لإنجاز العمل.
مهارات مقترحة
تصميم موقع إلكتروني
البحث والتطوير
تصميم صور
الكتابة على الإنترنت
باوربوينت
التدقيق اللغوي
قوالب شوبيفاي
إعادة صياغة المحتوى
الفكرة التصميمية
اسكتش اب
تجسيد 3D
تصميم بوسترات
مايكروسوفت أوفيس
تعديل الصور
3ds Max
حفظ العمل
العمل 3 من 3
تأكيد الشروط
جميع الأعمال من تنفيذي ولدي الصلاحية لنشرها
*
التالي
×
تم إضافة العمل إلى معرض أعمالك بنجاح
The dataset covered 20 countries across 10 years (2010–2019), including key indicators: GDP (USD, billions), Population (millions), Life Expectancy (years), Unemployment Rate (%), CO2 Emissions (metric tons per capita), Access to Electricity (%).
️ What I did: Built PivotTables to summarize trends by year and country, calculated Growth Rates (GDP Growth %, Electricity Access Growth %), designed KPI Cards to highlight key metrics (Avg GDP Growth, Avg Life Expectancy, Global Electricity Access, etc.), and visualized relationships with interactive charts.
What I found interesting: Countries with better electricity access usually showed higher life expectancy, some years had unexpected GDP jumps showing how economies can shift quickly, and growth often comes with a trade-off in CO2 emissions. This project gave me hands-on experience in data cleaning & formula-based calculations (growth %, YoY comparisons), pivot-based exploration & chart building, and designing an Excel dashboard that connects economic, social, and environmental indicators.