Statistical Analysis & Data Visualization Project in Excel
تفاصيل العمل
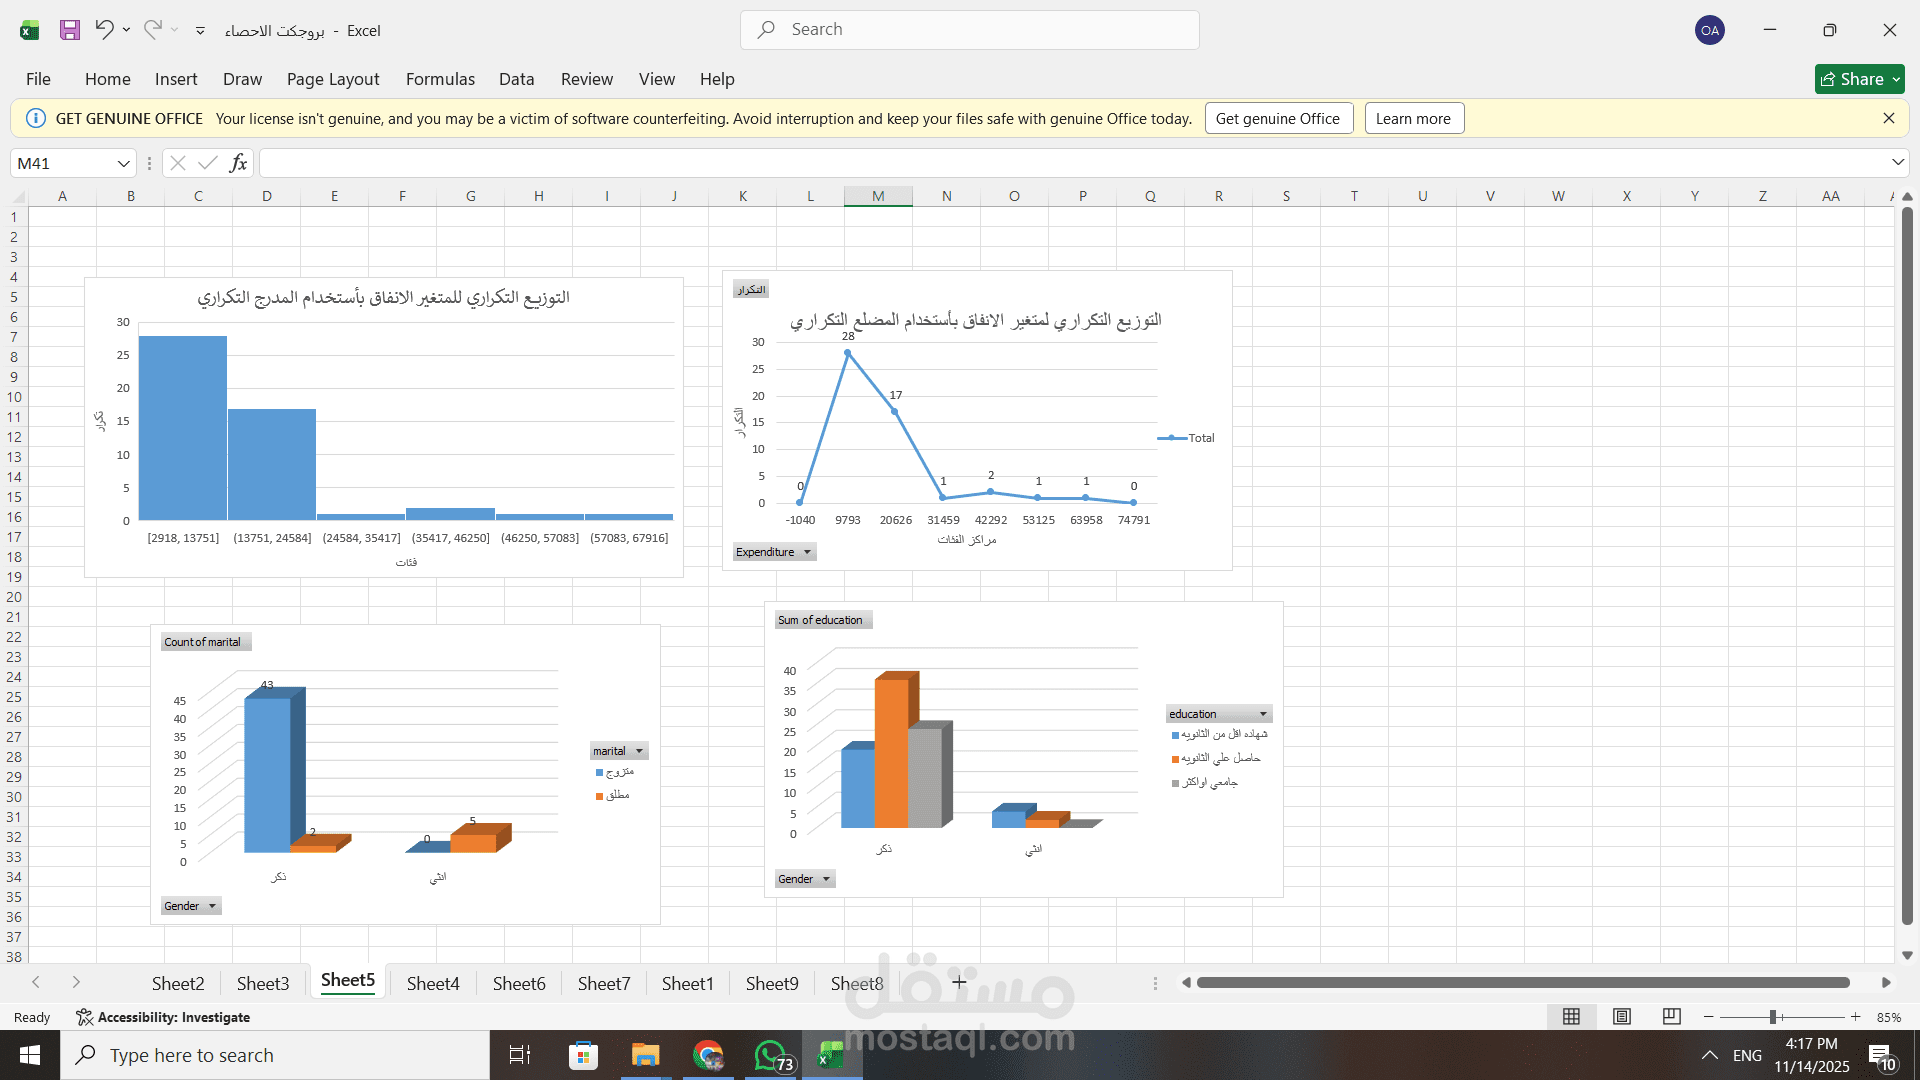
Spending Distribution Analysis:
Created a Histogram to visualize the frequency distribution of 'Spending' and identify the most common spending brackets.
Designed a Frequency Polygon to show the spending distribution trend.
Comparative Demographic Analysis:
Used Clustered Bar Charts to analyze and compare 'Marital Status' (Married, Divorced) across genders.
Developed a similar chart to compare 'Education Level' (Diploma, Training, Master's) between males and females.