Visualizing Concepts using Python
تفاصيل العمل

I visualized several phenomena in relativistic quantum mechanics using Python tools such as SciPy, NumPy, and Matplotlib.
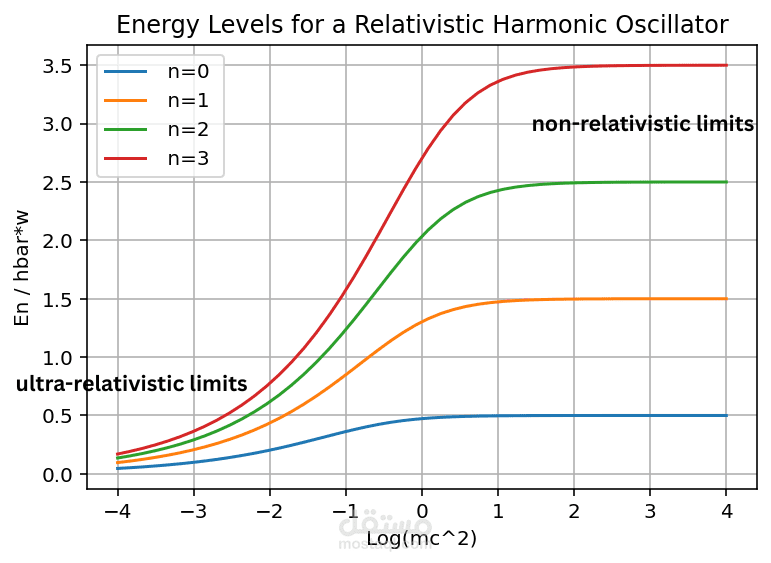
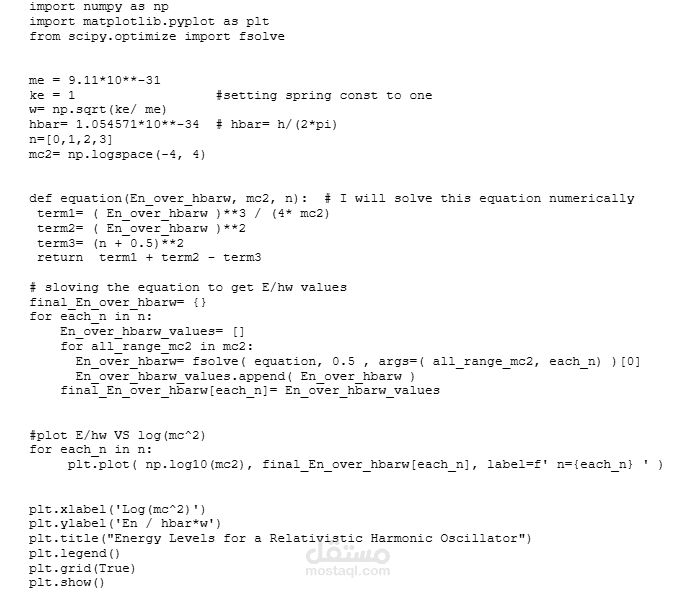
1️⃣ Energy levels of harmonic oscillators:
I explored how energy levels change with different quantum numbers in both the non-relativistic and ultra-relativistic limits. In the non-relativistic limit, energy levels are equally spaced, but in the ultra-relativistic regime, the energy spacing becomes non-uniform — highlighting the deviation from classical behavior. [1]
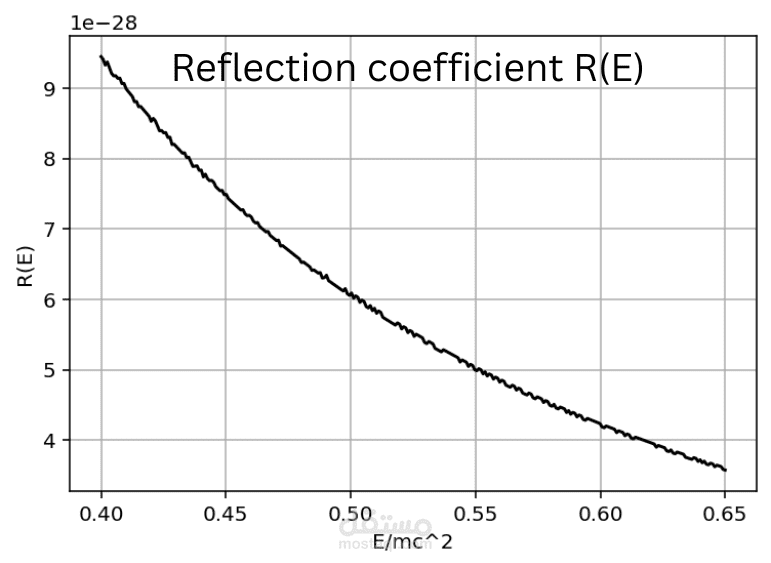
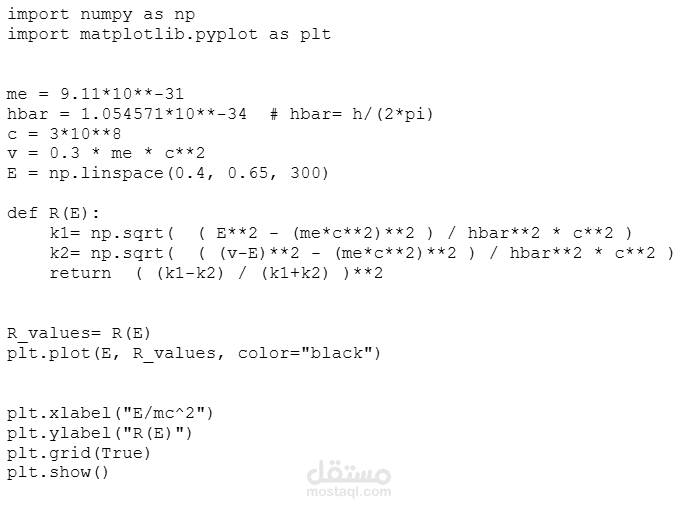
2️⃣ Reflection coefficient R(E):
Calculated for ?=?? (electron mass) and V=0.3mec2 using the PPGP equation, illustrating how reflection varies with particle energy. [2]
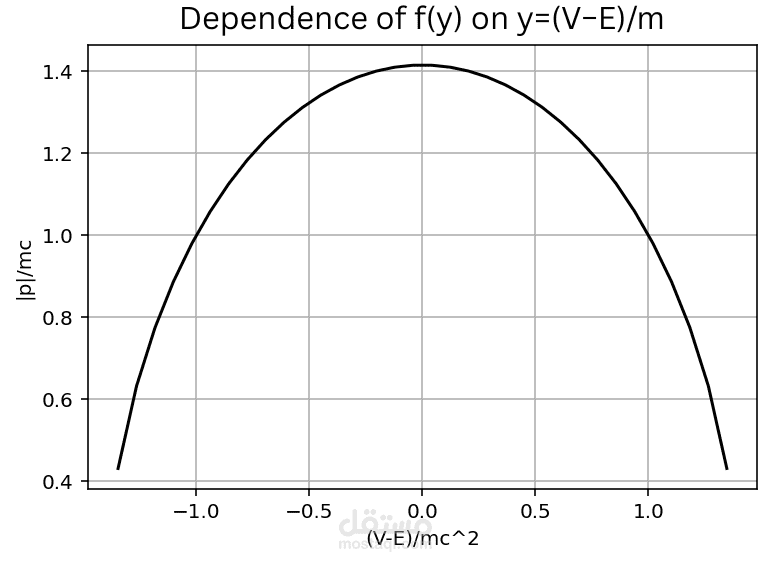
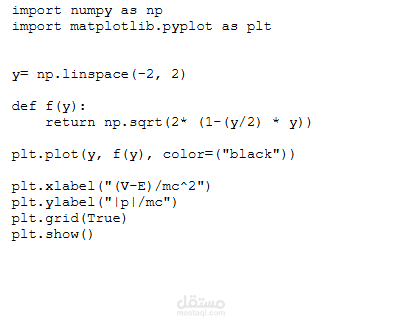
3️⃣ Dependence of f(y) on y=(V−E)/m:
This visualization shows how the particle’s momentum changes as the potential barrier varies relative to its energy. When E<V, quantum tunneling occurs — the particle can penetrate classically forbidden regions, with the wavefunction decaying exponentially inside the barrier ψ(x)∝e−κx. As V increases beyond E+mc2, the particle’s momentum decreases, and reflection becomes dominant. [3]
References:
[1] Fig. 4.2 & Eq. 4.21
[2] Fig. 4.4 & Eq. 4.36
[3] Fig. 4.5 & Eq. 4.43
(Source: Relativistic and Non-Relativistic Quantum Mechanics, Springer)
Visualizing quantum effects helps me connect theory with physical intuition — and I really enjoyed exploring these concepts computationally