Real Estate Market Analysis Dashboard
تفاصيل العمل
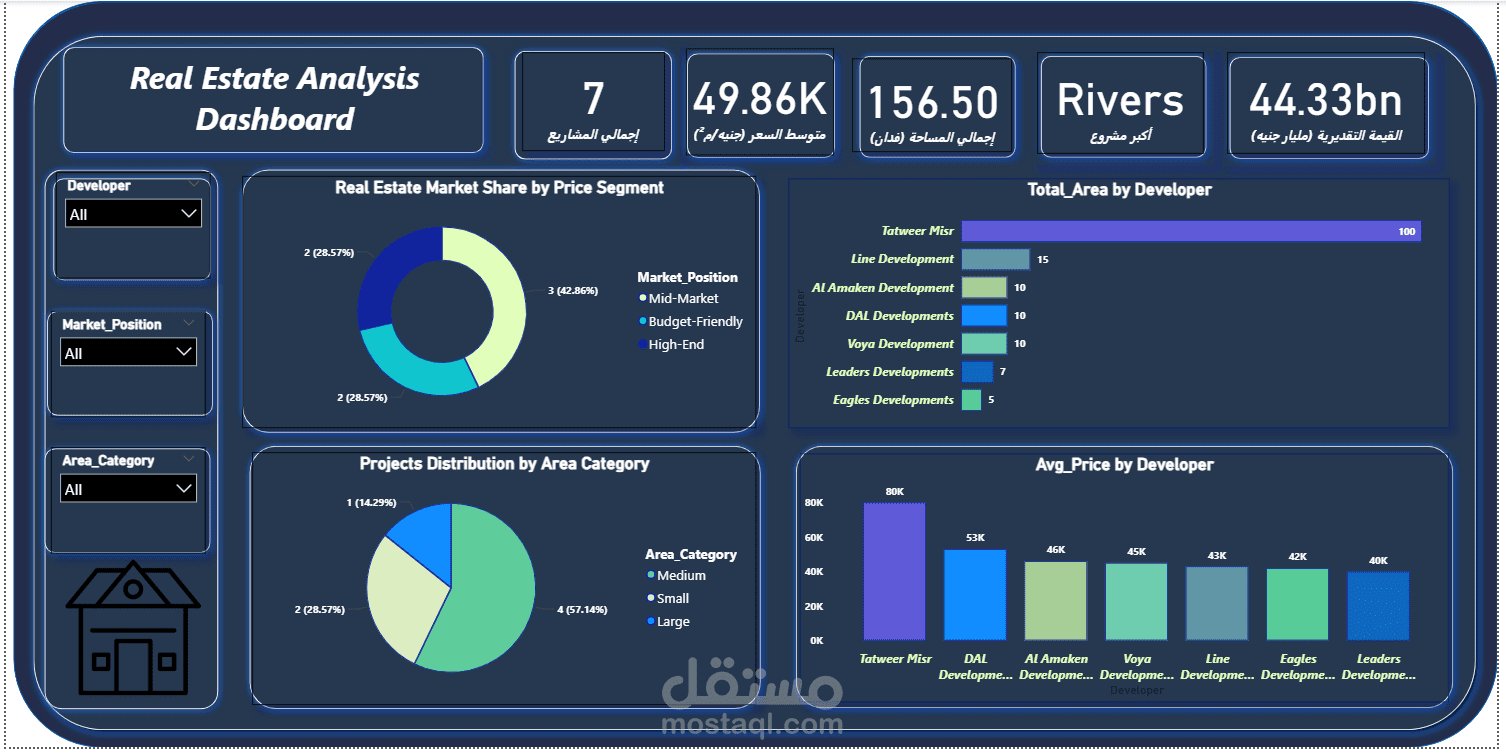

Interactive dashboard built using Power BI to analyze the real estate market.
This project provides insights into property developers, project sizes, estimated values, and market positioning.
KPIs to track:
Total number of projects.
Total number of developers.
Average, maximum, and minimum price per square meter.
Estimated project values (in billions EGP).
Largest projects by area.
Market segmentation (High-End / Mid-Market / Budget).
Comparison of project prices vs market average.
Visualizations: bar charts, donut charts, KPI cards, and slicers.
The market is dominated by small projects → opportunity for large-scale developments.
Most projects are positioned in the High-End segment → opportunity exists in Mid-Market and Budget housing.
A few developers control most of the market → diversification could reduce risk.
Prices vary widely, with some projects significantly above market average → may indicate overpriced areas.