Blinkit Grocery Dashboard
تفاصيل العمل
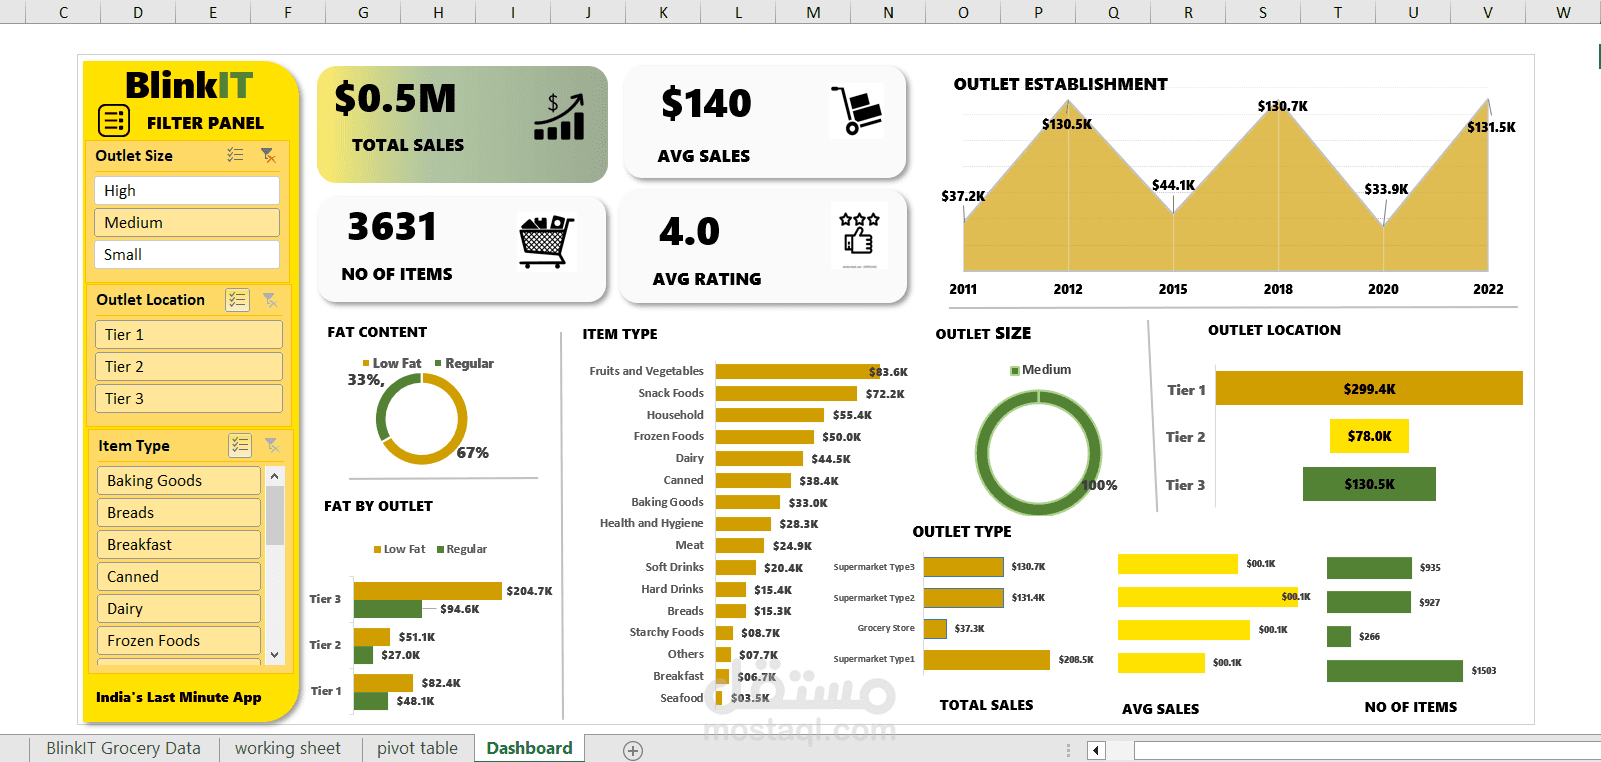
a sales data analysis project for blinkit using Microsoft Excel .
The goal is to understand sales performance , identify top selling products and items ,and build a dashboard to support data driven business decisions.
-Objectives
analyze total sales, average sales , No of items and average rating of products.
identify the highest sales items according to their type and location in the store
analyze sales records and trends by years
build a dynamic dashboard with a clear insights
-Tools used
Microsoft excel (cleaning data ,pivot tables , charts , slicers )