DA-Brazilian-ECommerce-Customer-Segmentation
تفاصيل العمل
This project analyzes the Brazilian E-Commerce Public Dataset (Olist) to gain insights into customer behavior, purchasing trends, delivery efficiency, and payment methods. The goal is to explore the data, clean and preprocess it, perform analysis, and segment customers based on their purchase patterns.
Dataset Description
The dataset includes multiple related tables covering orders, payments, products, sellers, and customer information.
Key columns used in this analysis:
order_id: Unique order identifier
customer_id: Unique customer identifier
order_status: Status of the order (delivered, shipped, canceled, etc.)
order_purchase_timestamp: Time of purchase
payment_type: Method of payment (credit card, boleto, etc.)
price / freight_value: Product and shipping costs
product_category_name: Product category
customer_city / state: Customer location
️ Steps and Methods
1. Data Cleaning and Preprocessing
Handled missing values appropriately
Converted timestamp columns to datetime format
Corrected data types for numerical and categorical features
Removed duplicates and irrelevant records
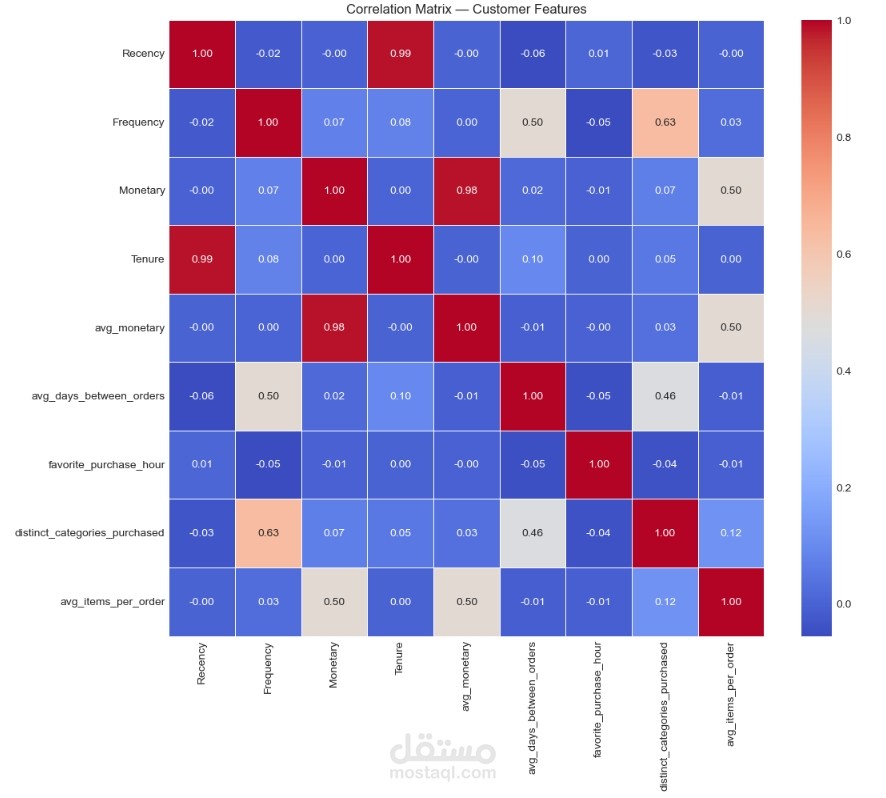
2. Feature Engineering
Calculated delivery time, estimated vs. actual delivery difference
Created revenue-related metrics
Extracted customer-level aggregates for segmentation
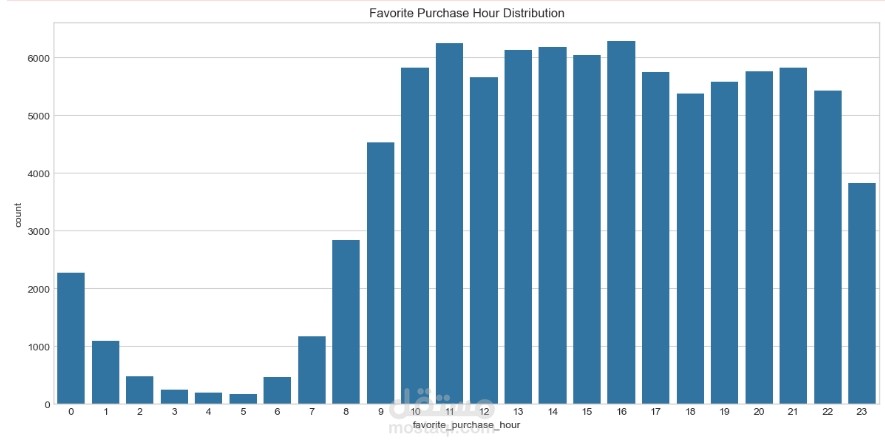
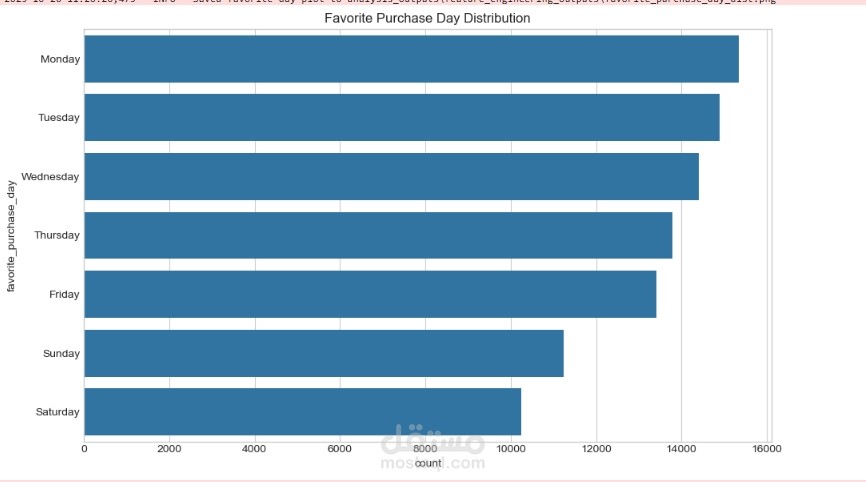
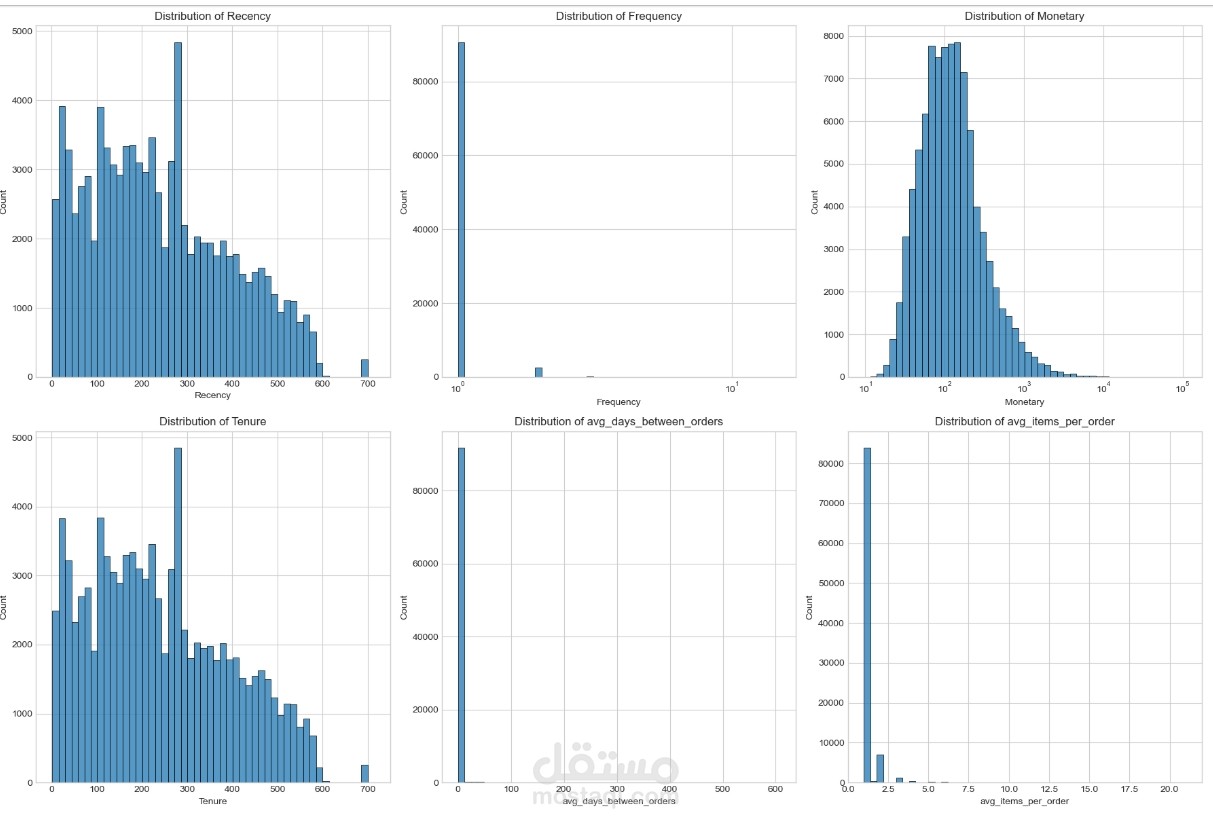
3. Exploratory Data Analysis (EDA)
Visualized sales over time
Analyzed top-selling categories
Compared actual vs. estimated delivery times
Studied payment distribution and customer states
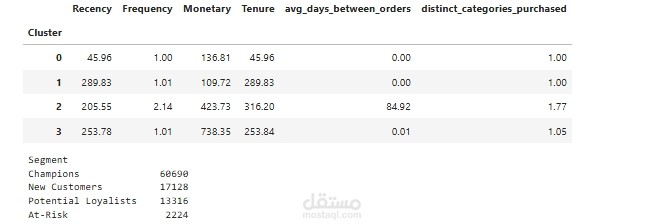
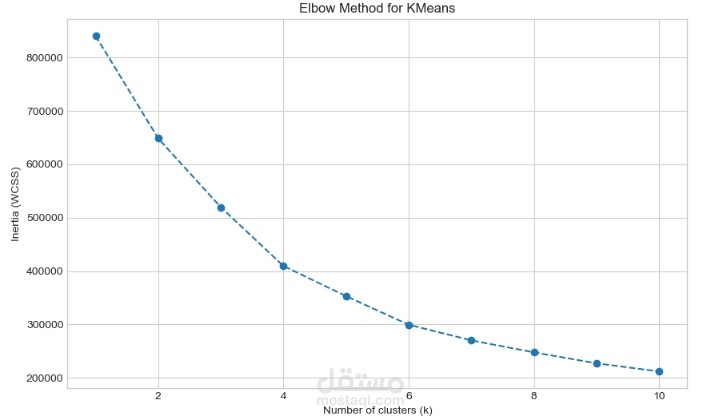
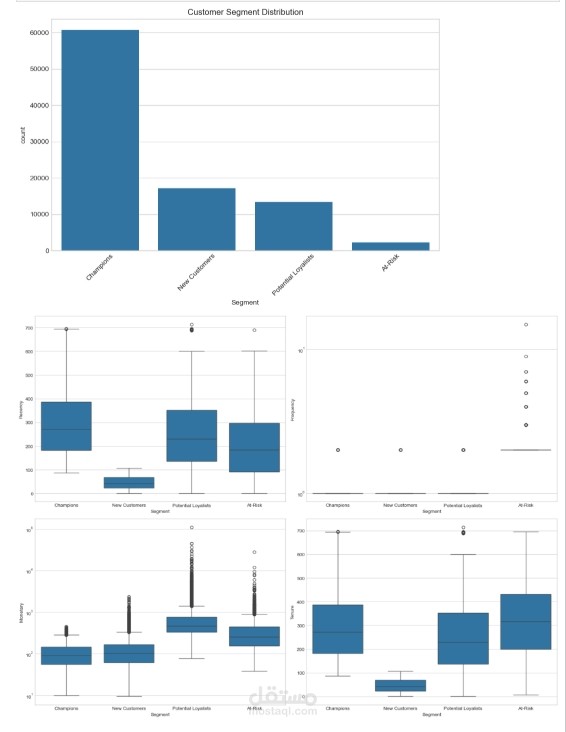
4. Customer Segmentation
Clustered customers based on purchase frequency, monetary value, and recency
Identified high-value and low-engagement segments
Tools and Technologies
Python
Pandas, NumPy
Matplotlib, Seaborn, Plotly
Scikit-learn (for segmentation)
Jupyter Notebook
? Results and Insights
Most customers preferred credit card payments
Delivery delays were observed in specific regions
Identified top product categories contributing to revenue
Customer segmentation revealed clear behavioral patterns useful for targeted marketing
Future Improvements
Integrate machine learning models for customer lifetime value prediction
Build a dashboard using Power BI or Streamlit
Automate data pipelines for regular updates