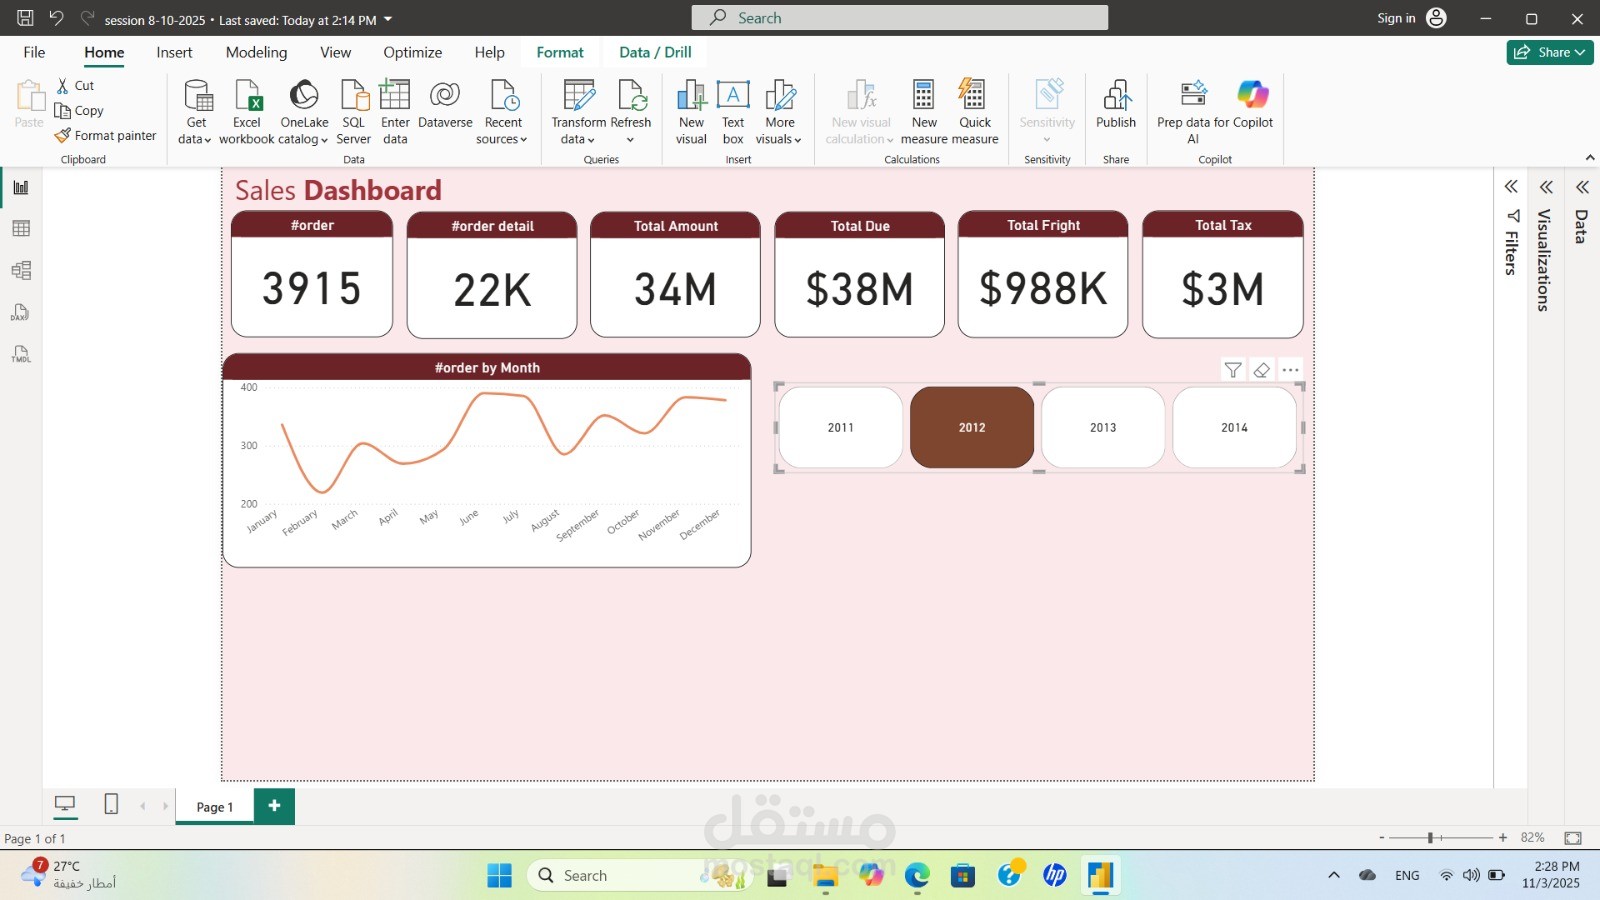
sales dashboard
تفاصيل العمل
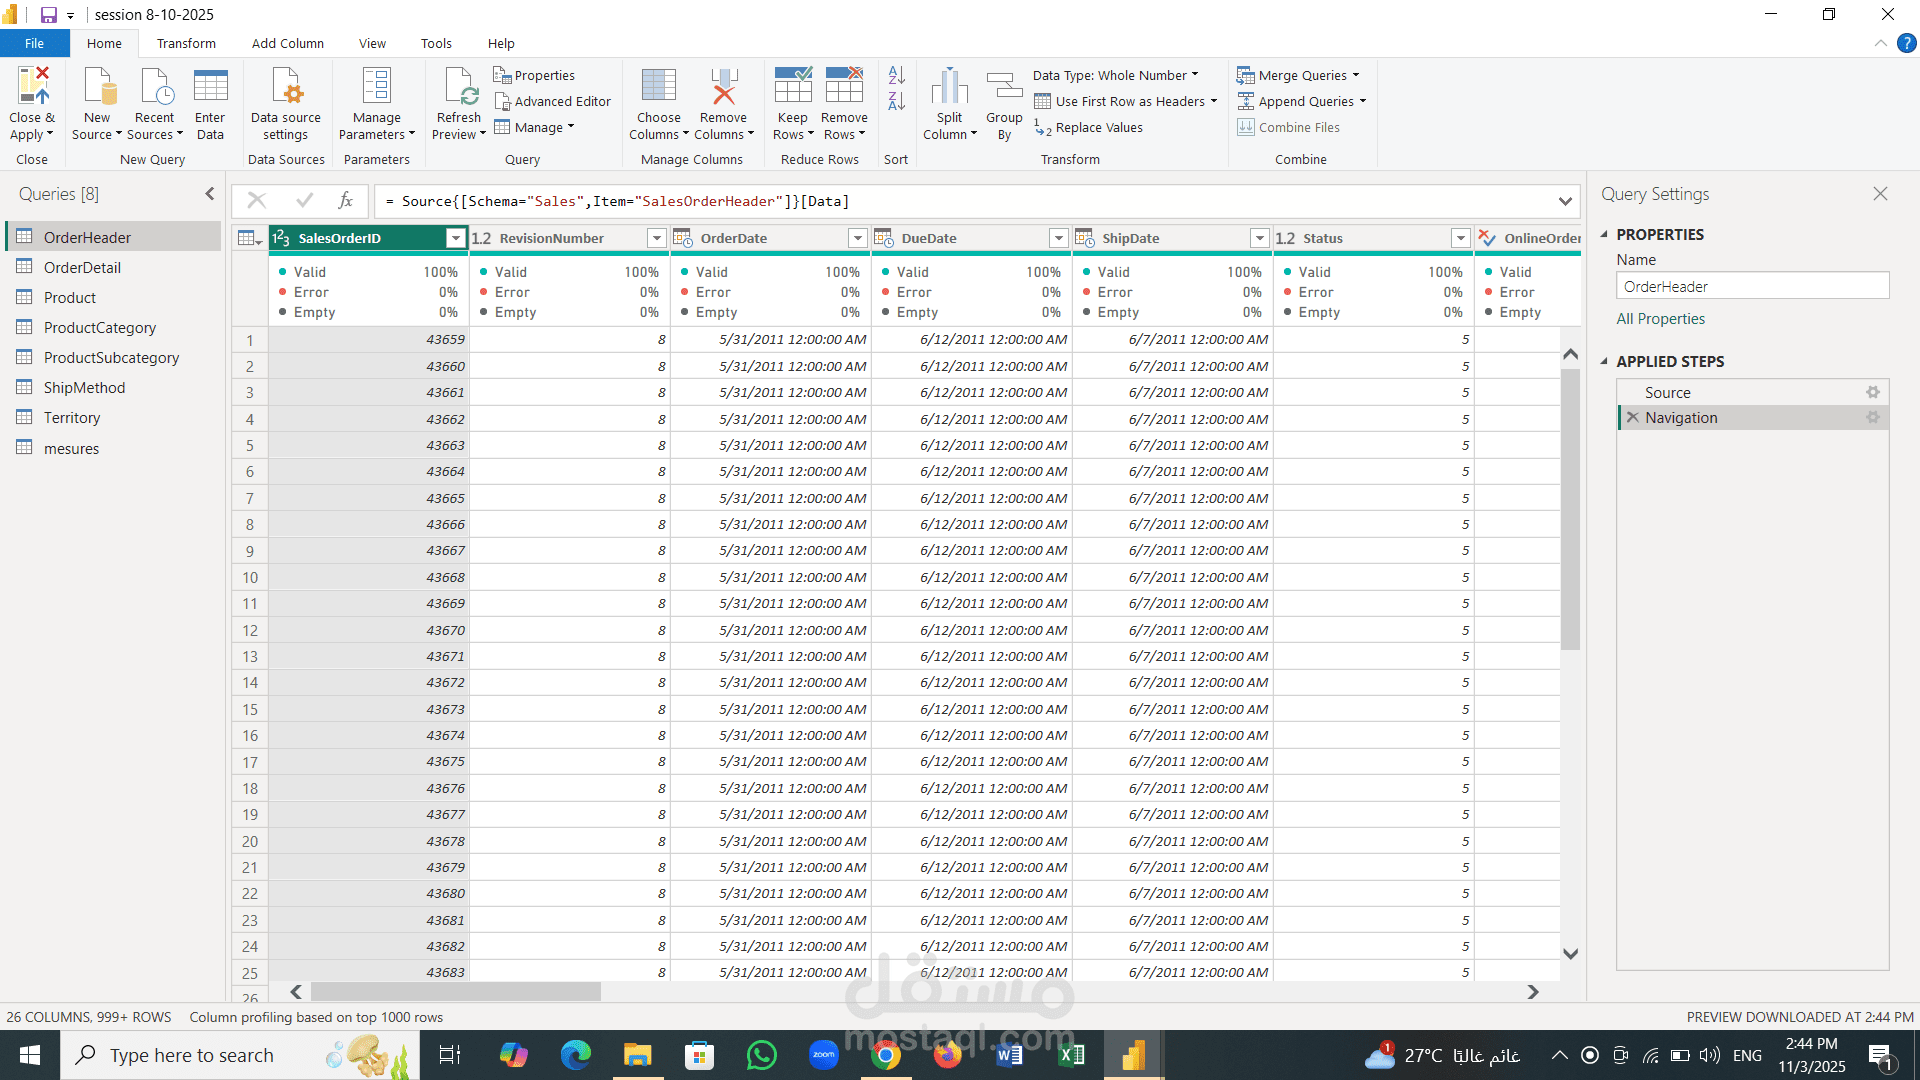
1. Data Modeling & Preparation
Identify and define Fact and Dimension tables from your Excel file.
Group and organize related Dimension tables logically (e.g., Customer, Product, Time, etc.).
Create unique IDs/Keys for each Dimension table (if not already present).
Merge or relate Dimension tables with the Fact table using Power BI relationships.
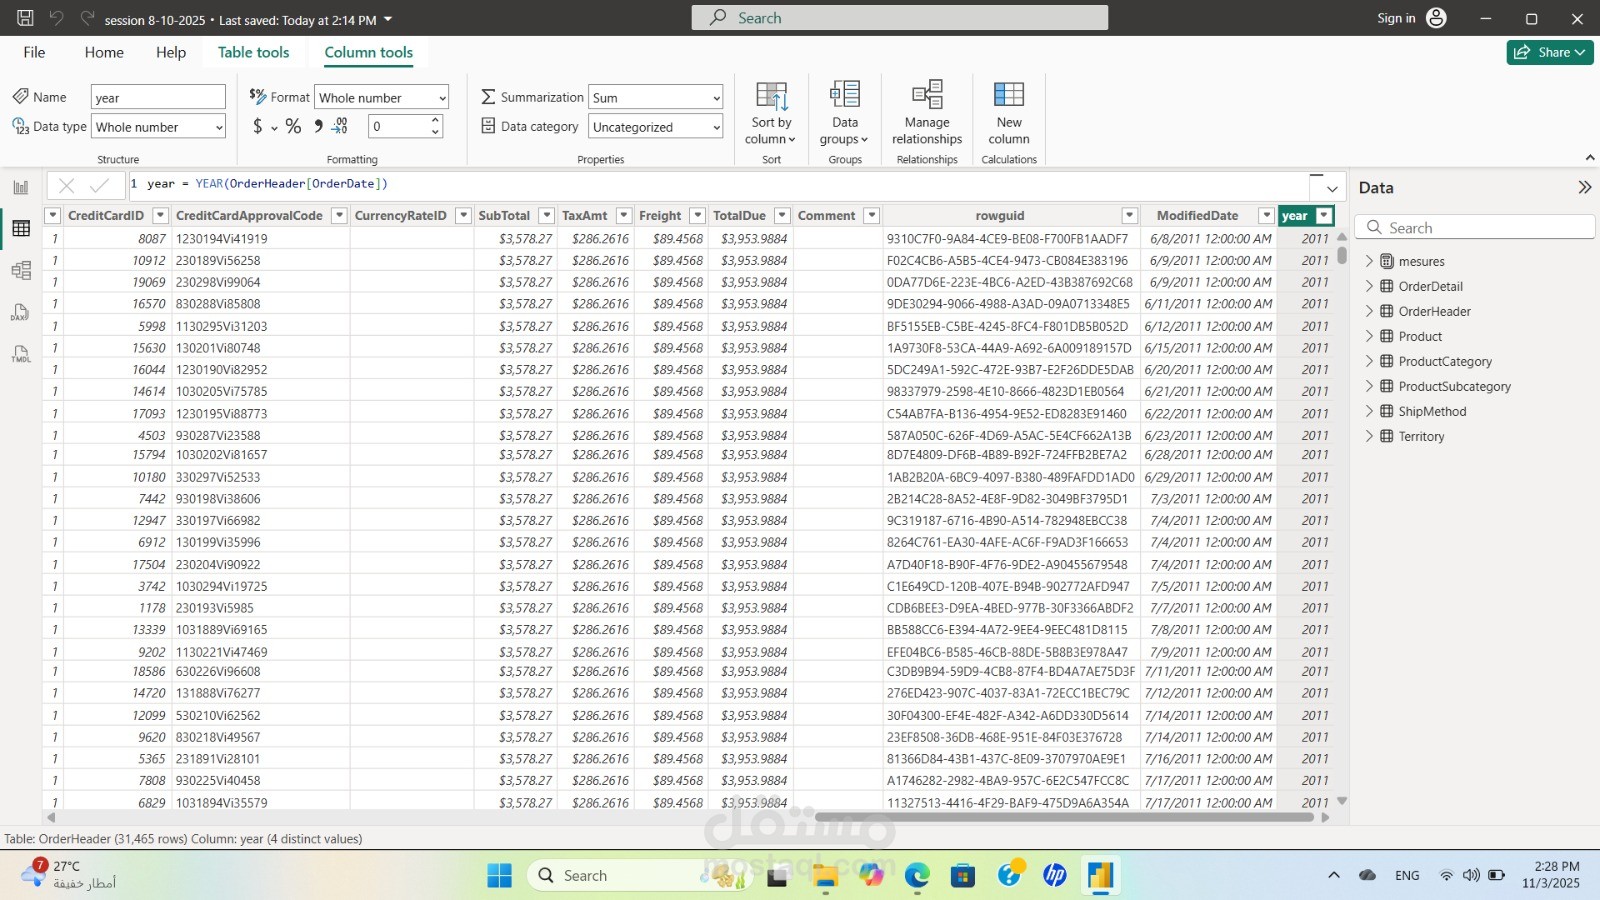
Extract and clean fields — for example, creating new calculated columns such as:
Year, Month, or Quarter from date columns.
Derived attributes needed for reporting or grouping.
Design an optimized Star Schema for a scalable and efficient data model.
2. Visualization & Dashboard Design
Define key Measures and KPIs using DAX (e.g., Total Sales, Profit Margin, Growth %).
Build an interactive dashboard with professional, intuitive visuals.
Add Slicers and Filters for dynamic analysis (e.g., by Year, Product, Region, or Category).
Choose appropriate chart types and layouts to best represent each measure (bar, line, pie, map, etc.).
Apply consistent color themes and layouts aligned with your brand identity.
Ensure interactivity, responsiveness, and smooth performance.
Deliverables:
A complete Power BI (.pbix) report file.
Optimized Data Model (Star Schema) structure.
Interactive dashboard with measures, charts, slicers, and calculated columns.
Optional exported visuals in PDF or PNG format.