Sales Performance Dashboard
تفاصيل العمل
Category: Data Analysis & Reports
Tools: Microsoft Excel, Power BI
Description:
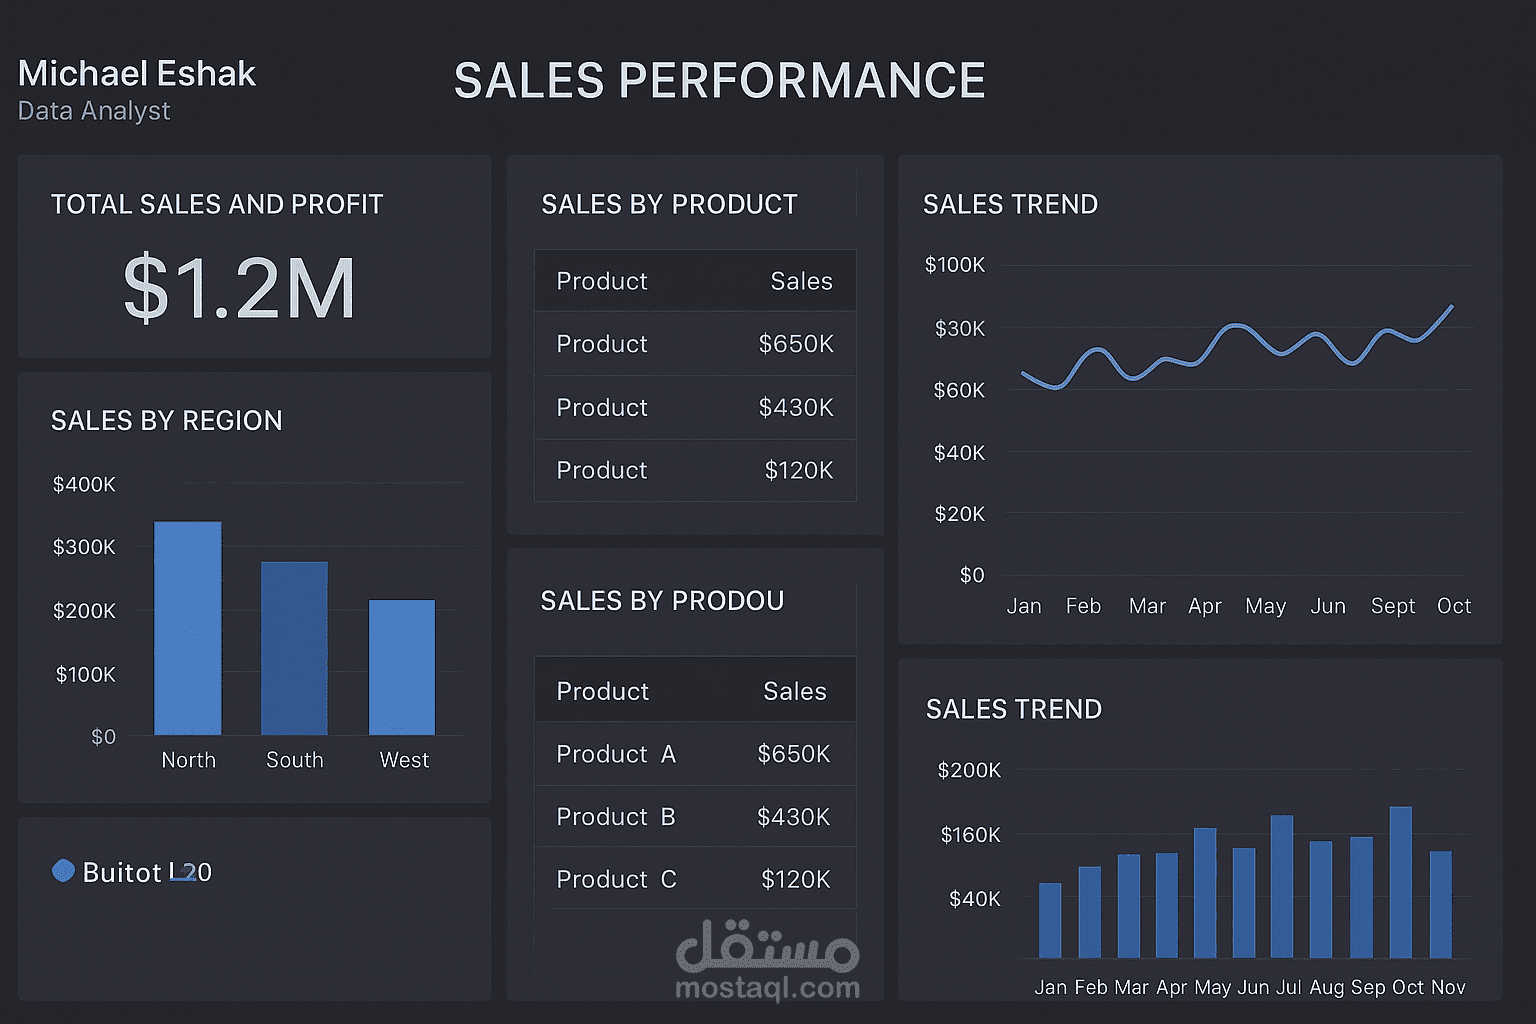
This project demonstrates my ability to analyze and visualize sales data using Excel and Power BI.
I collected and cleaned raw sales data, built Pivot Tables, and created a dynamic dashboard showing key metrics such as Total Revenue, Top Products, and Monthly Trends.
The dashboard helps businesses identify high-performing products and sales periods, enabling data-driven decisions to improve growth.
Skills:
Data Analysis
Power BI
Excel Dashboards
Data Visualization
Business Intelligence