تحليل البيانات
تفاصيل العمل
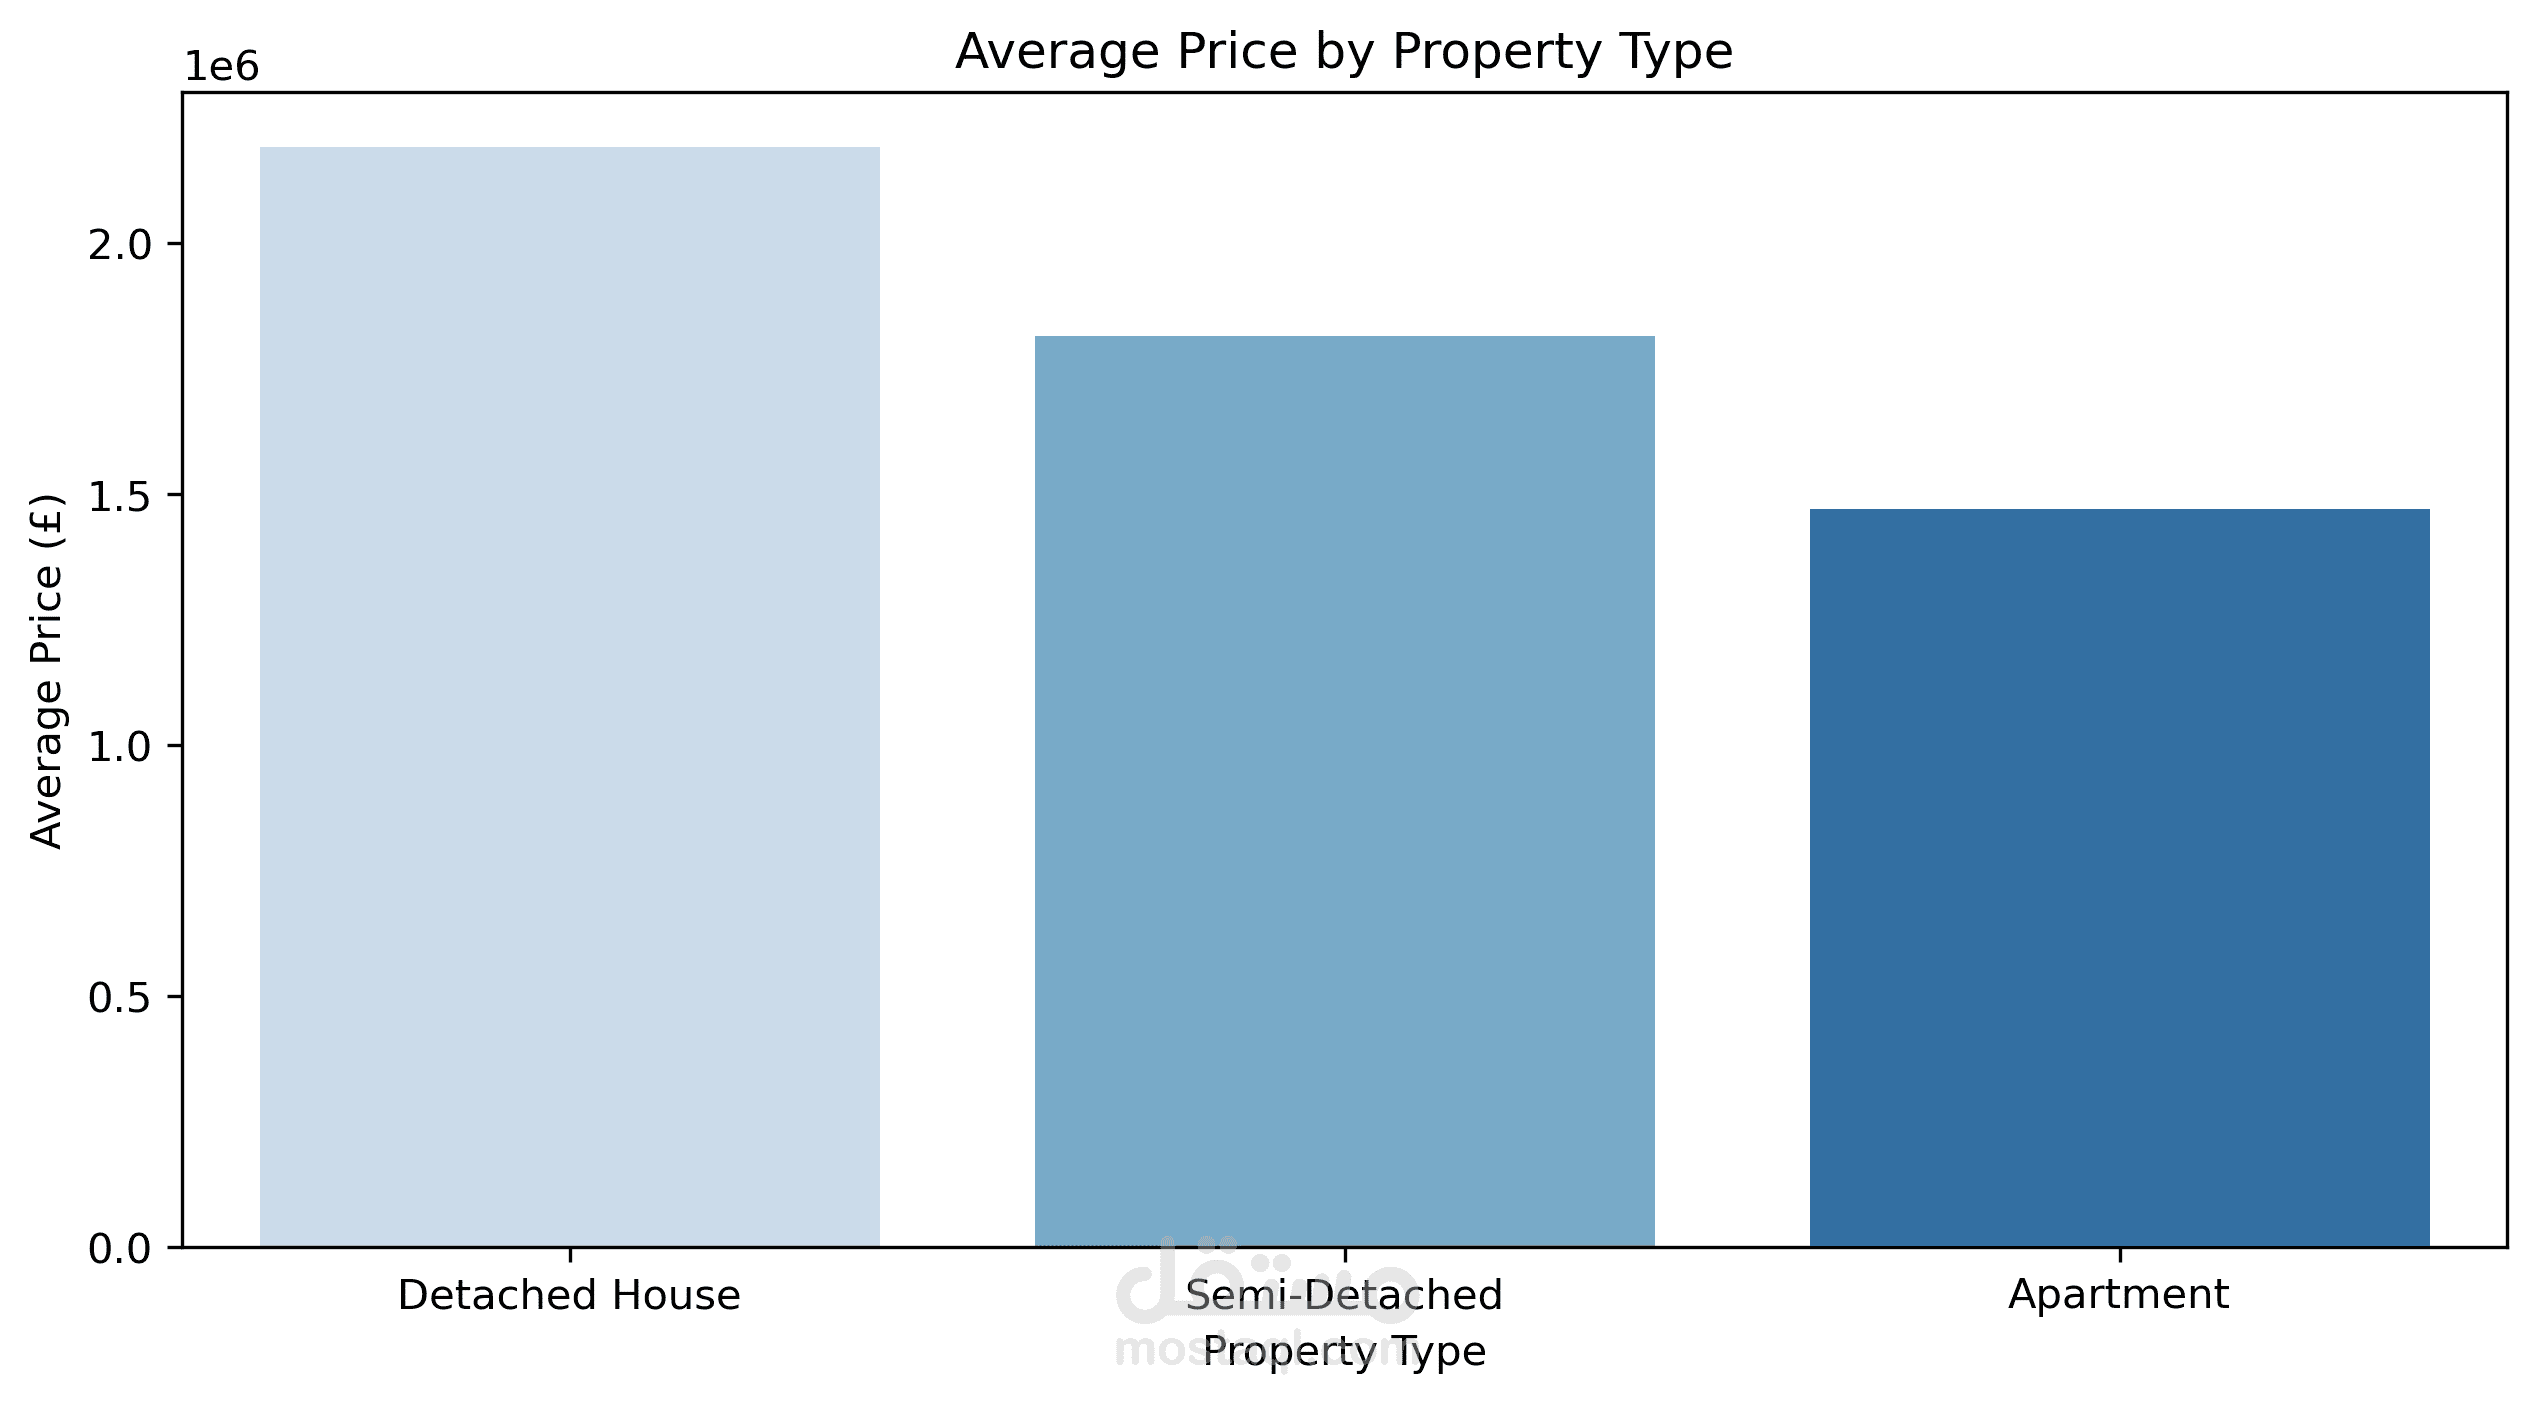
Thrilled to share the results of my recent data analysis project on 1,000 London residential properties! This was a fantastic exercise in applying classroom knowledge to real-world data complexity.
What I Did:
Data Wrangling: Used Python (Pandas) to clean, inspect, and prepare 17 features for analysis.
Visualization & EDA: Created a dashboard (including scatter plots, box plots, and bar charts) using Matplotlib and Seaborn to tell the data story.
Key Insight: Found a massive price premium linked to condition over age. New and Renovated properties consistently outperformed older homes in average price, highlighting the market's demand for modern features like Underfloor Heating.