Cafe Sales Dashboard
تفاصيل العمل
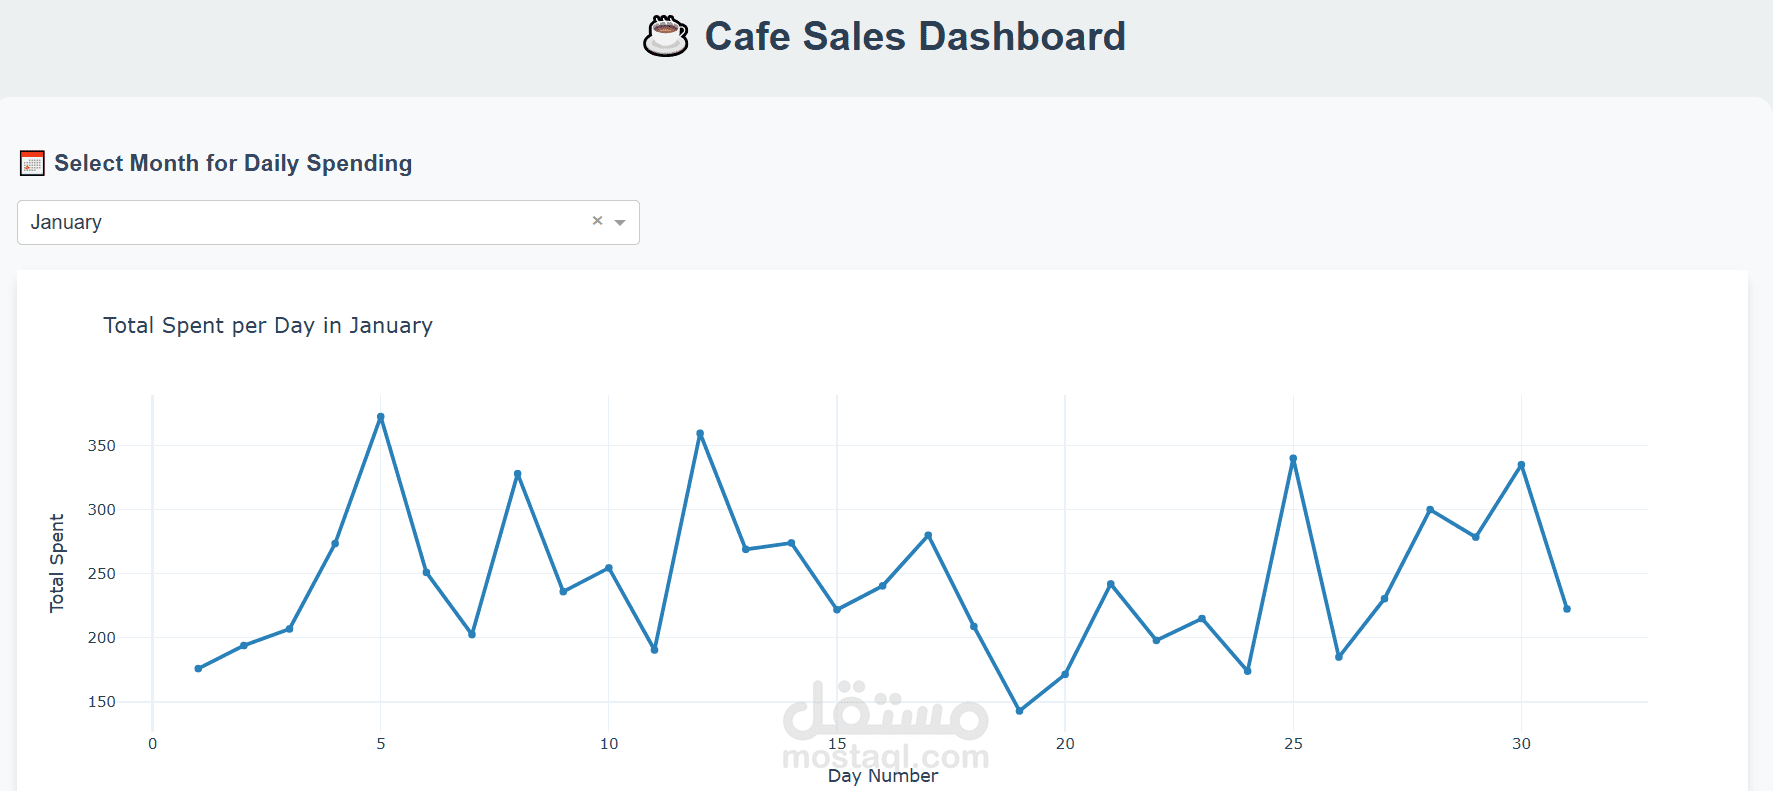
This project is a Cafe Sales Dashboard built with Dash.
It provides interactive visualizations for:
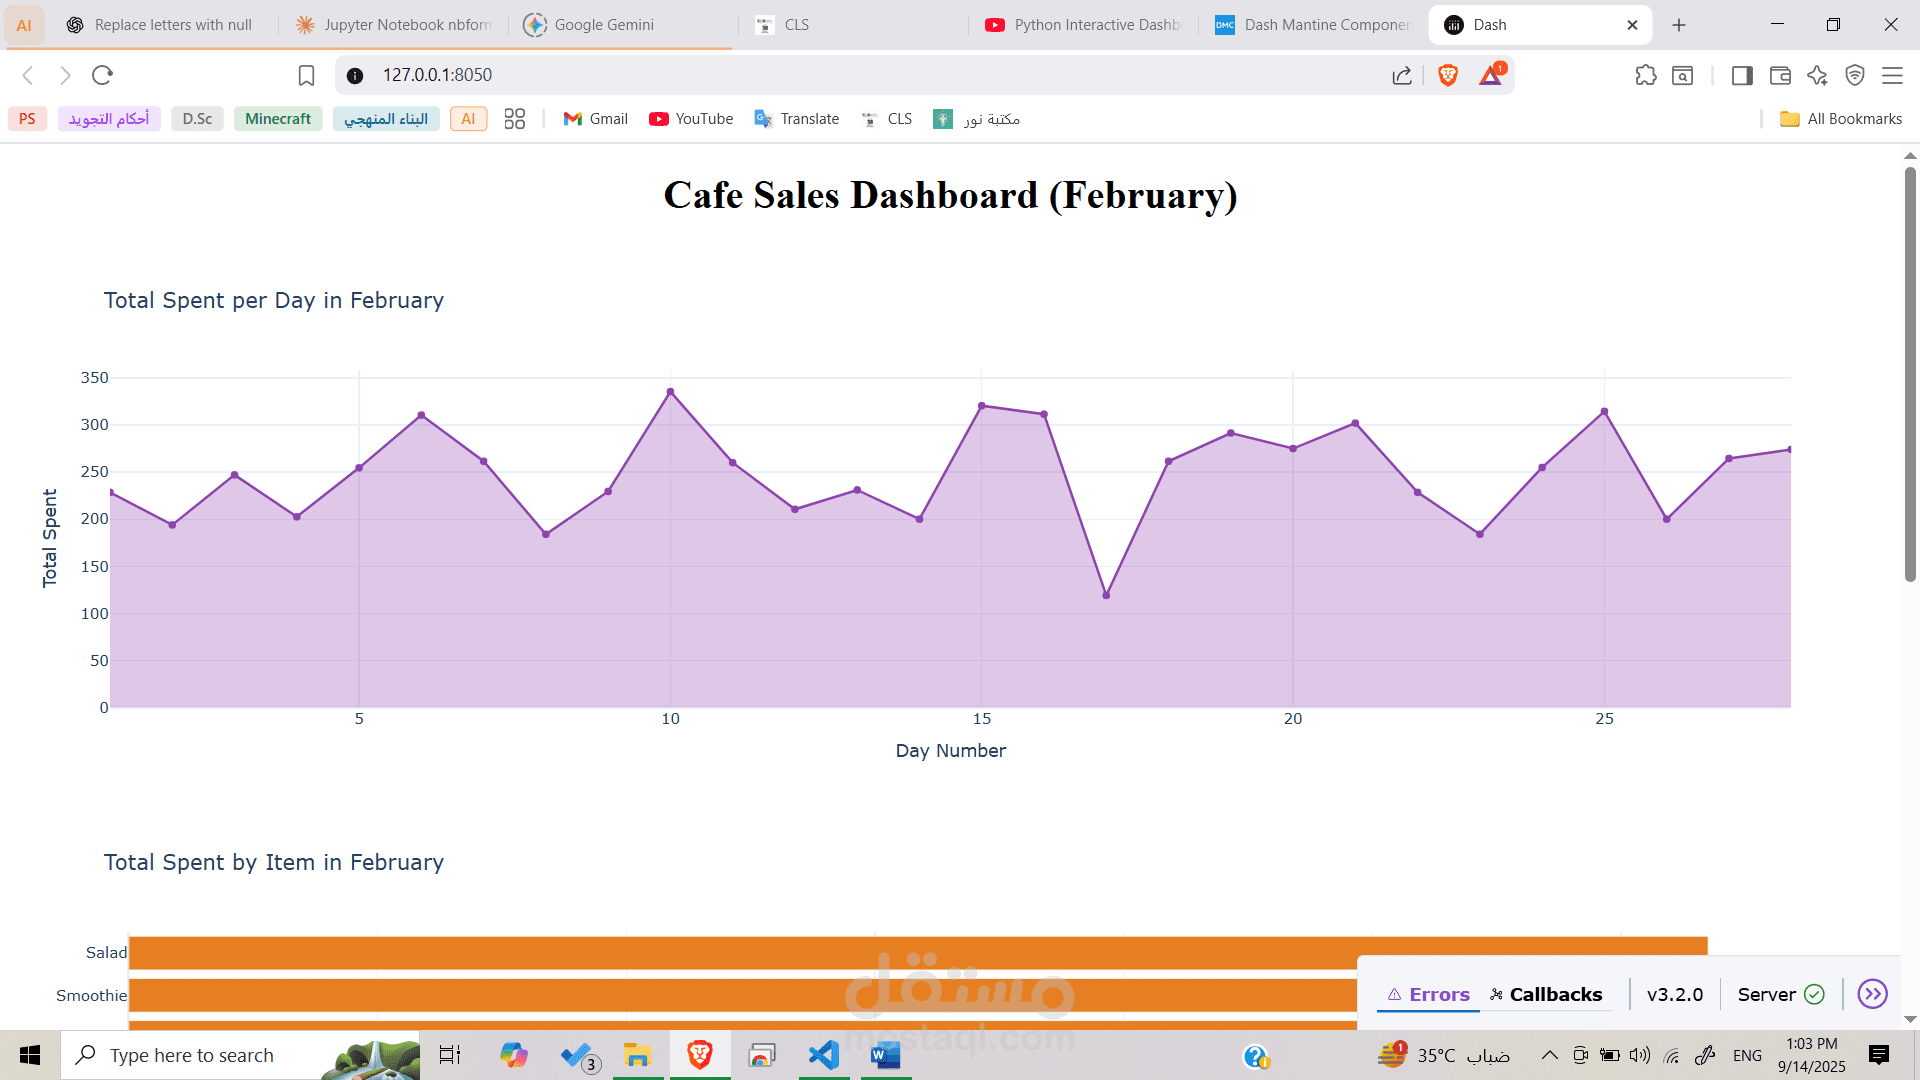
Daily Spending Trends: Track total sales per day for any given month.
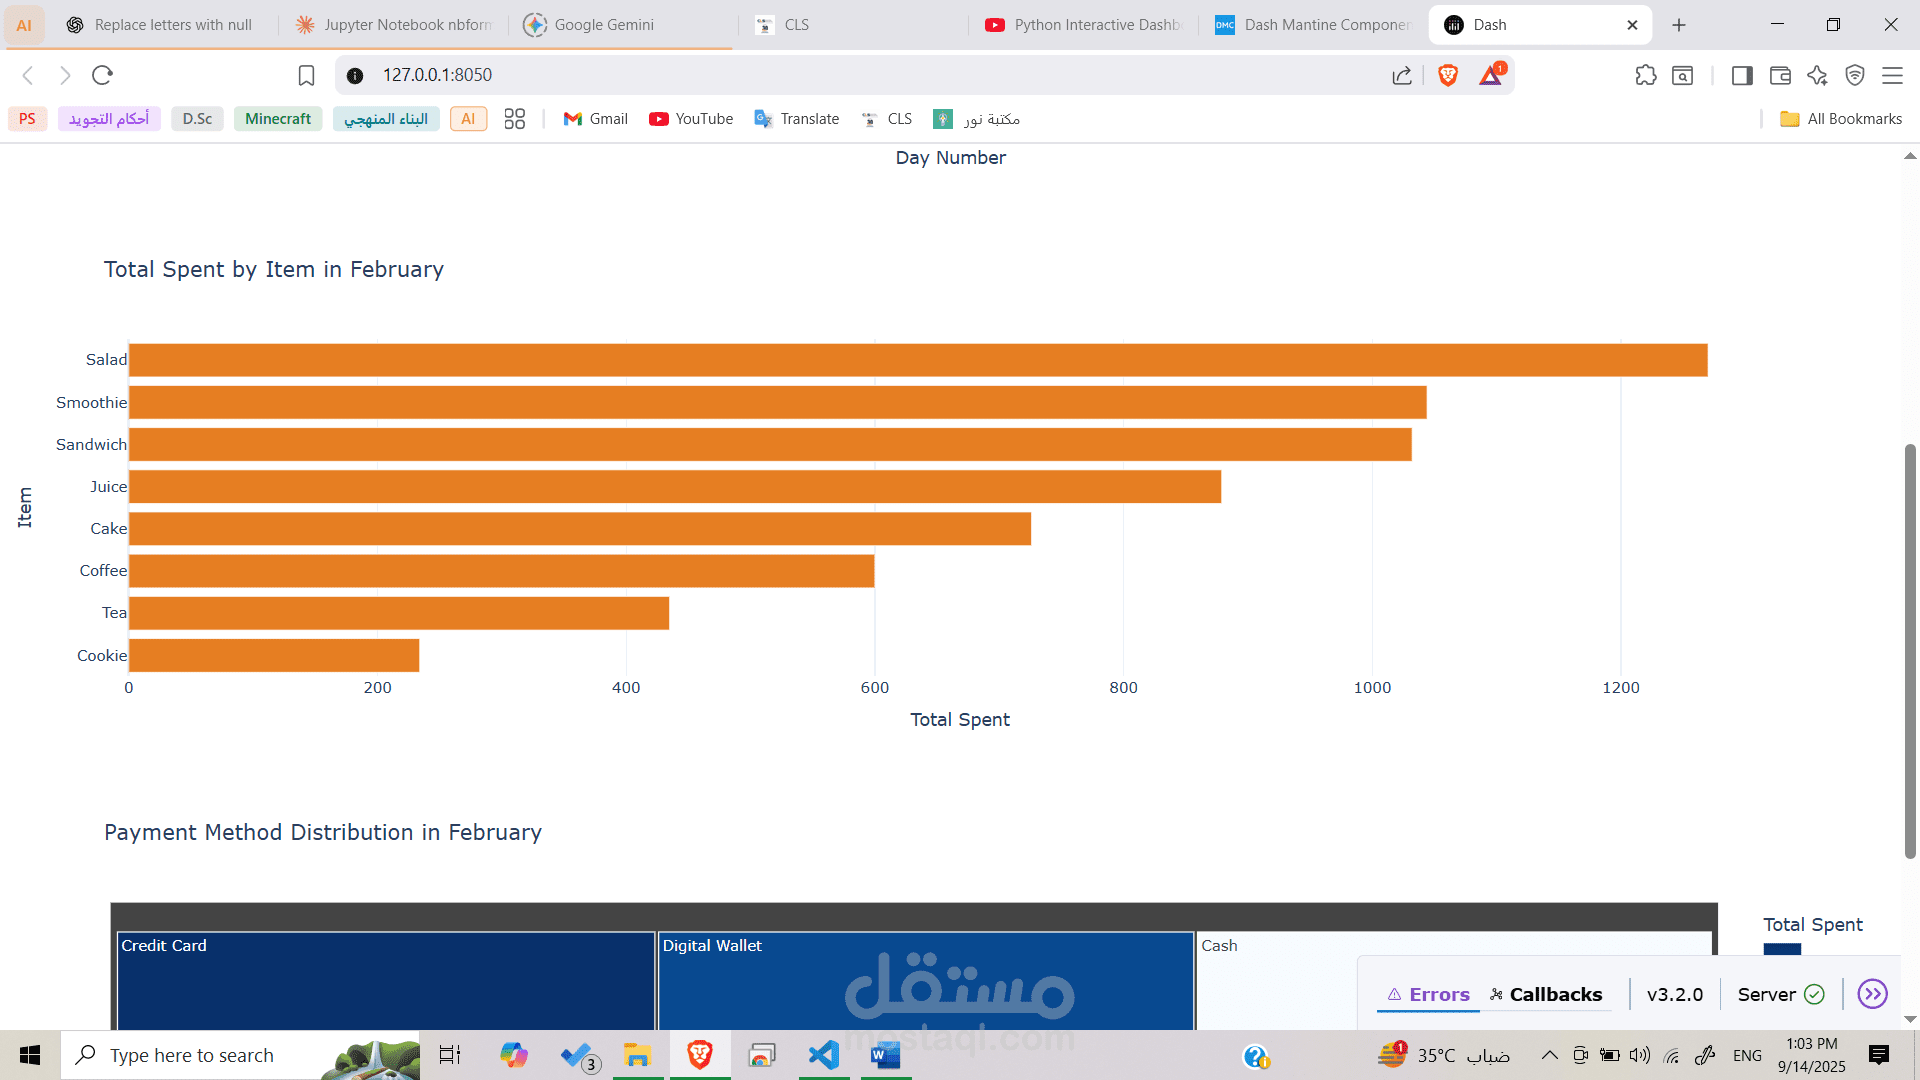
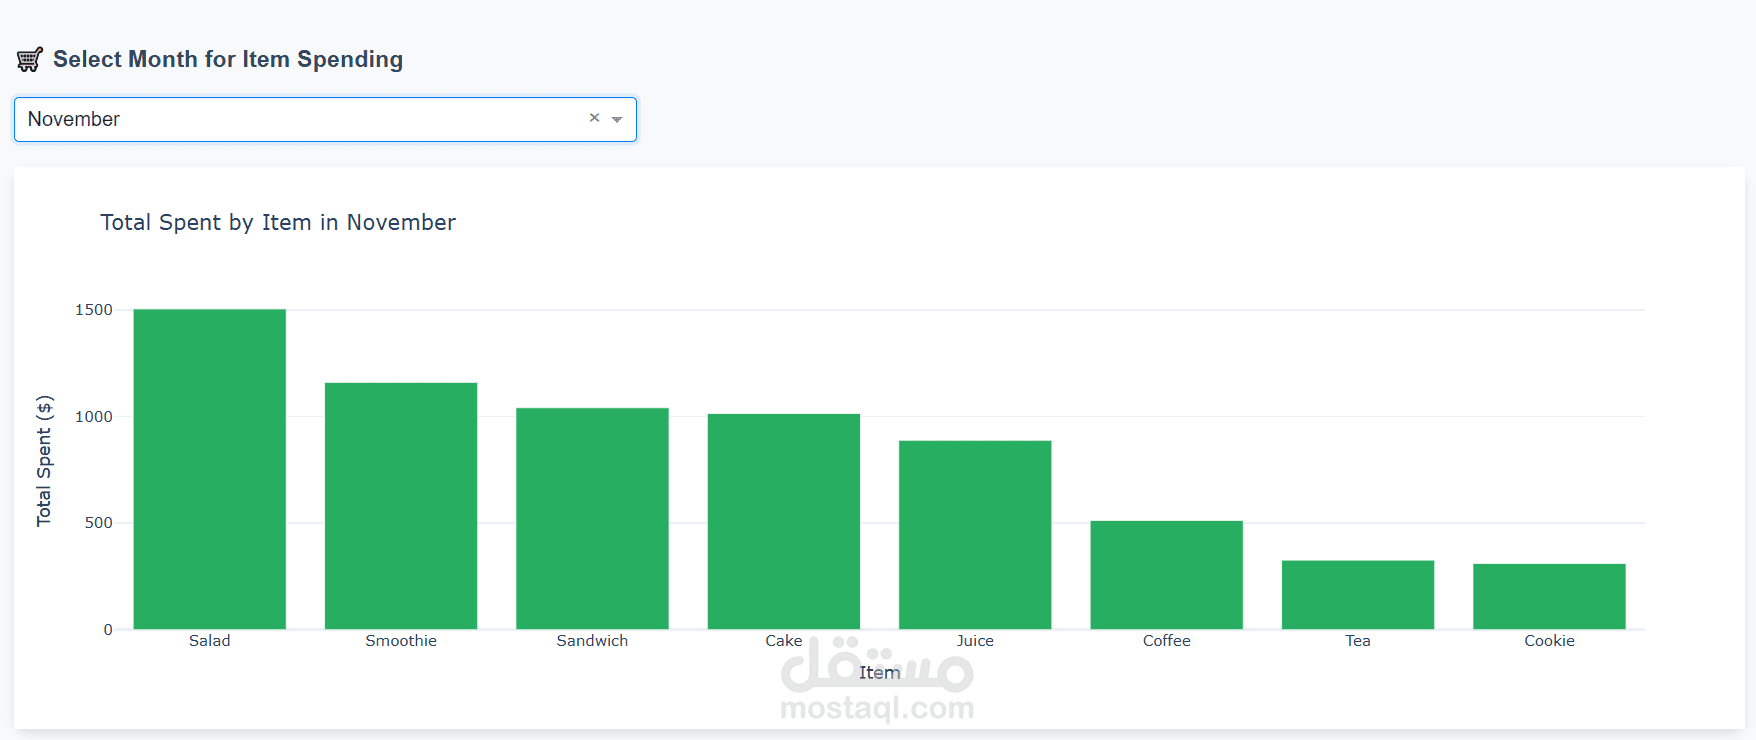
Item Sales Performance: See which menu items generate the most revenue.
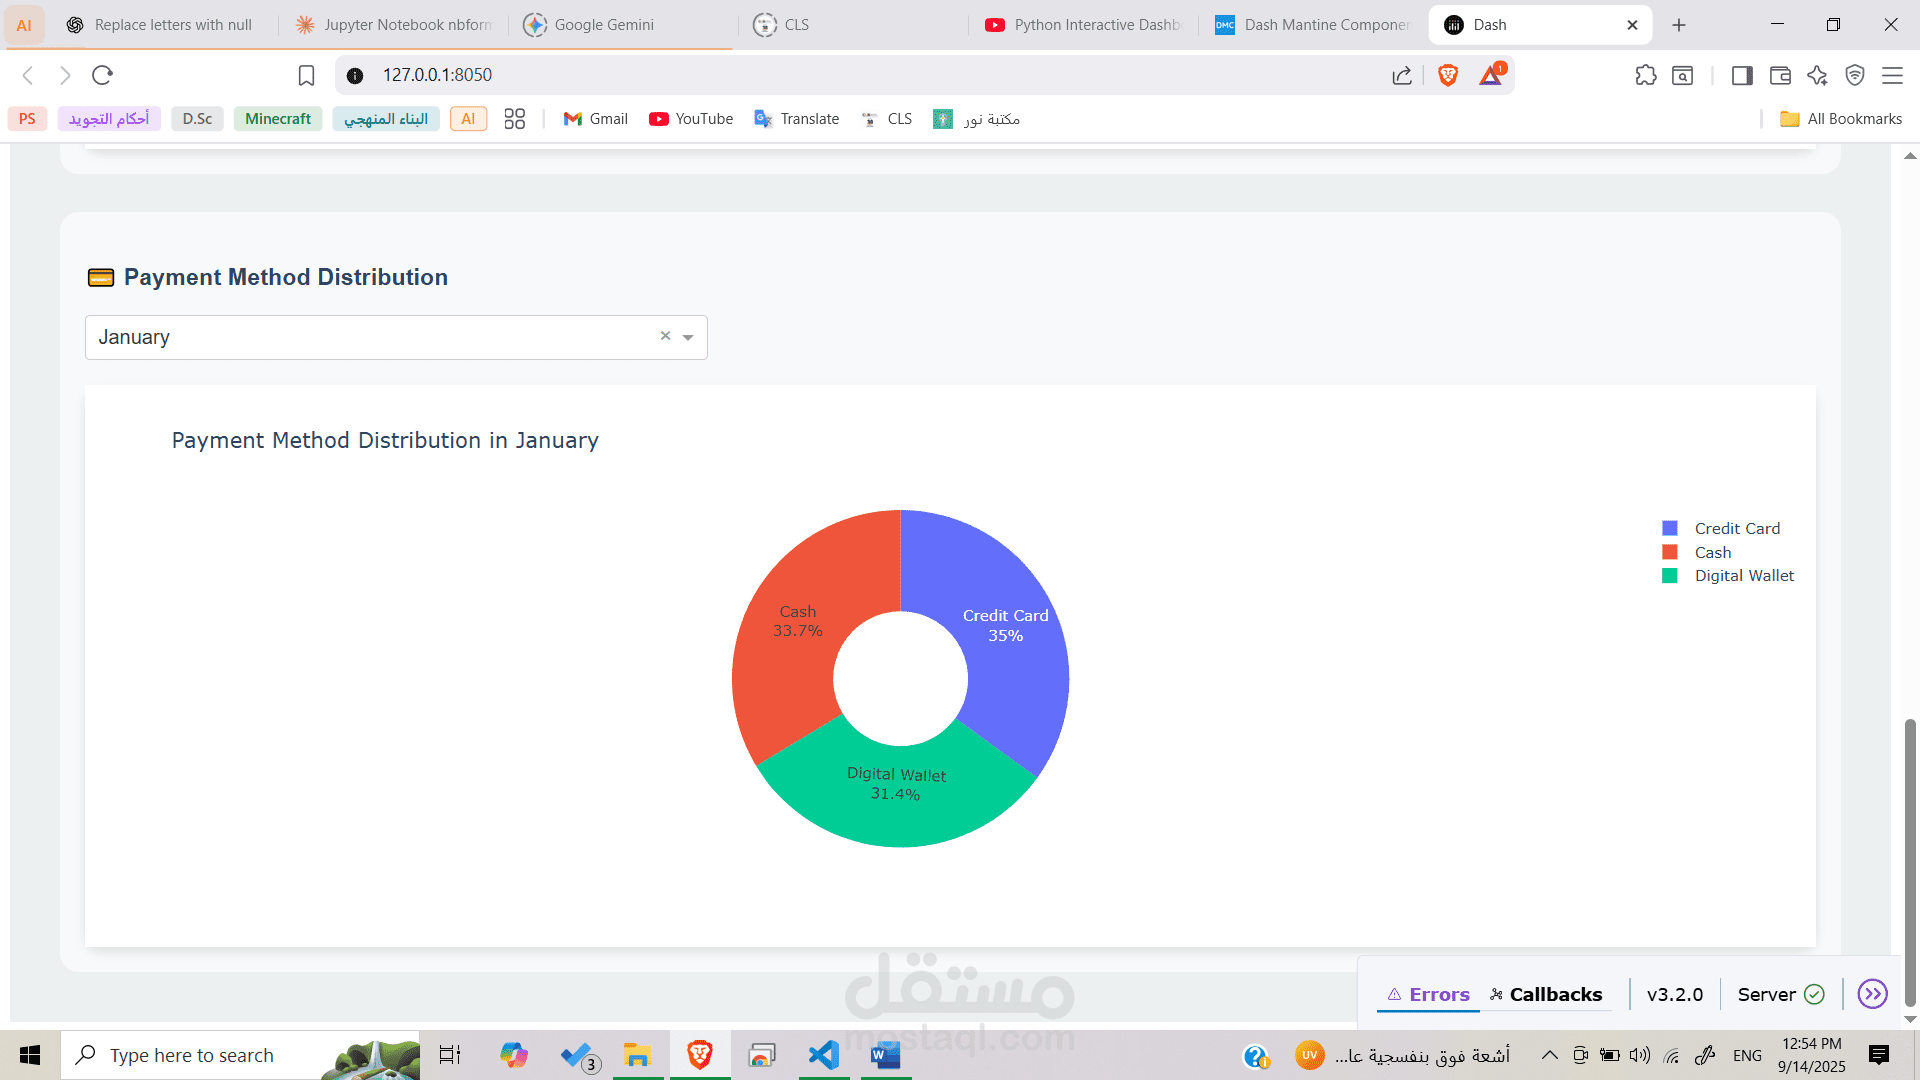
Payment Method Distribution: Understand how customers prefer to pay (Cash, Credit Card, Digital Wallet).
Users can filter all charts by month to gain actionable insights into café performance and customer behavior.