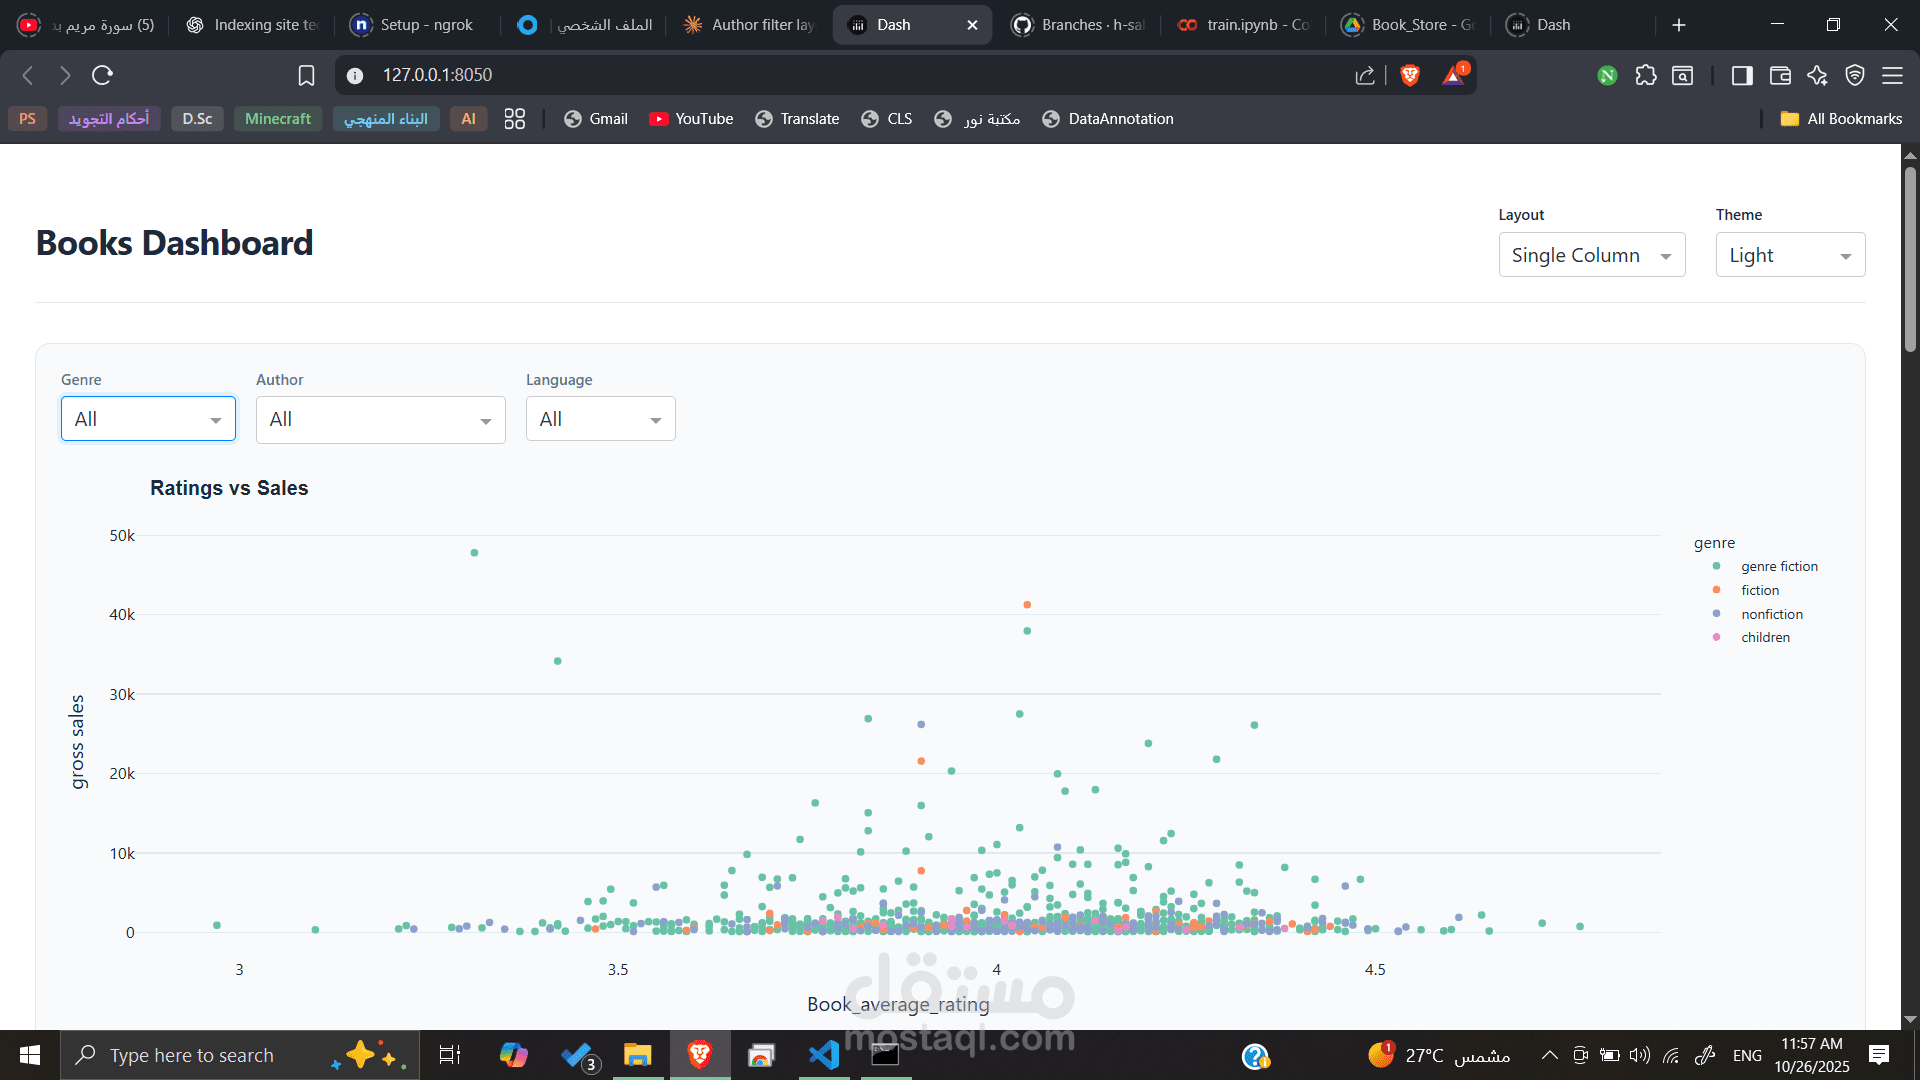
Books Dashboard
تفاصيل العمل
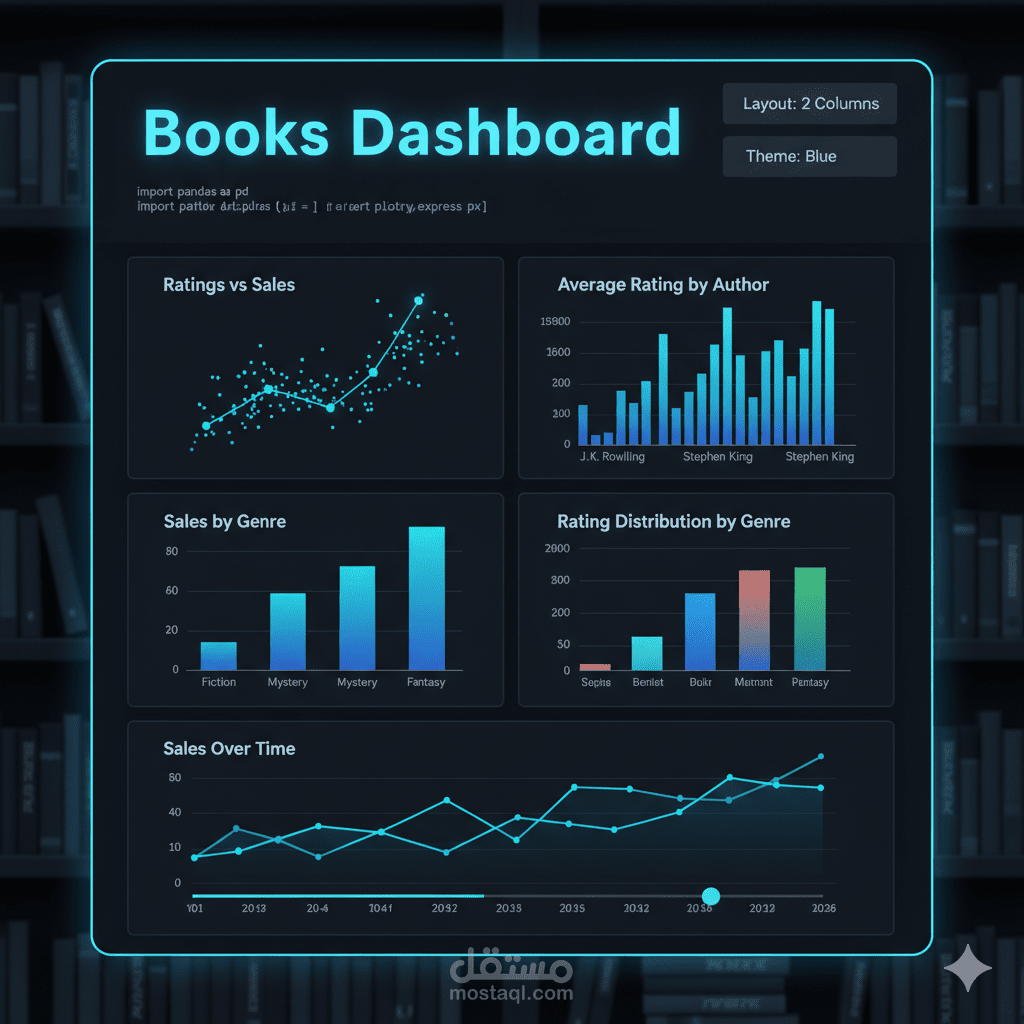
This project is a book data analysis and interactive dashboard.
It covers:
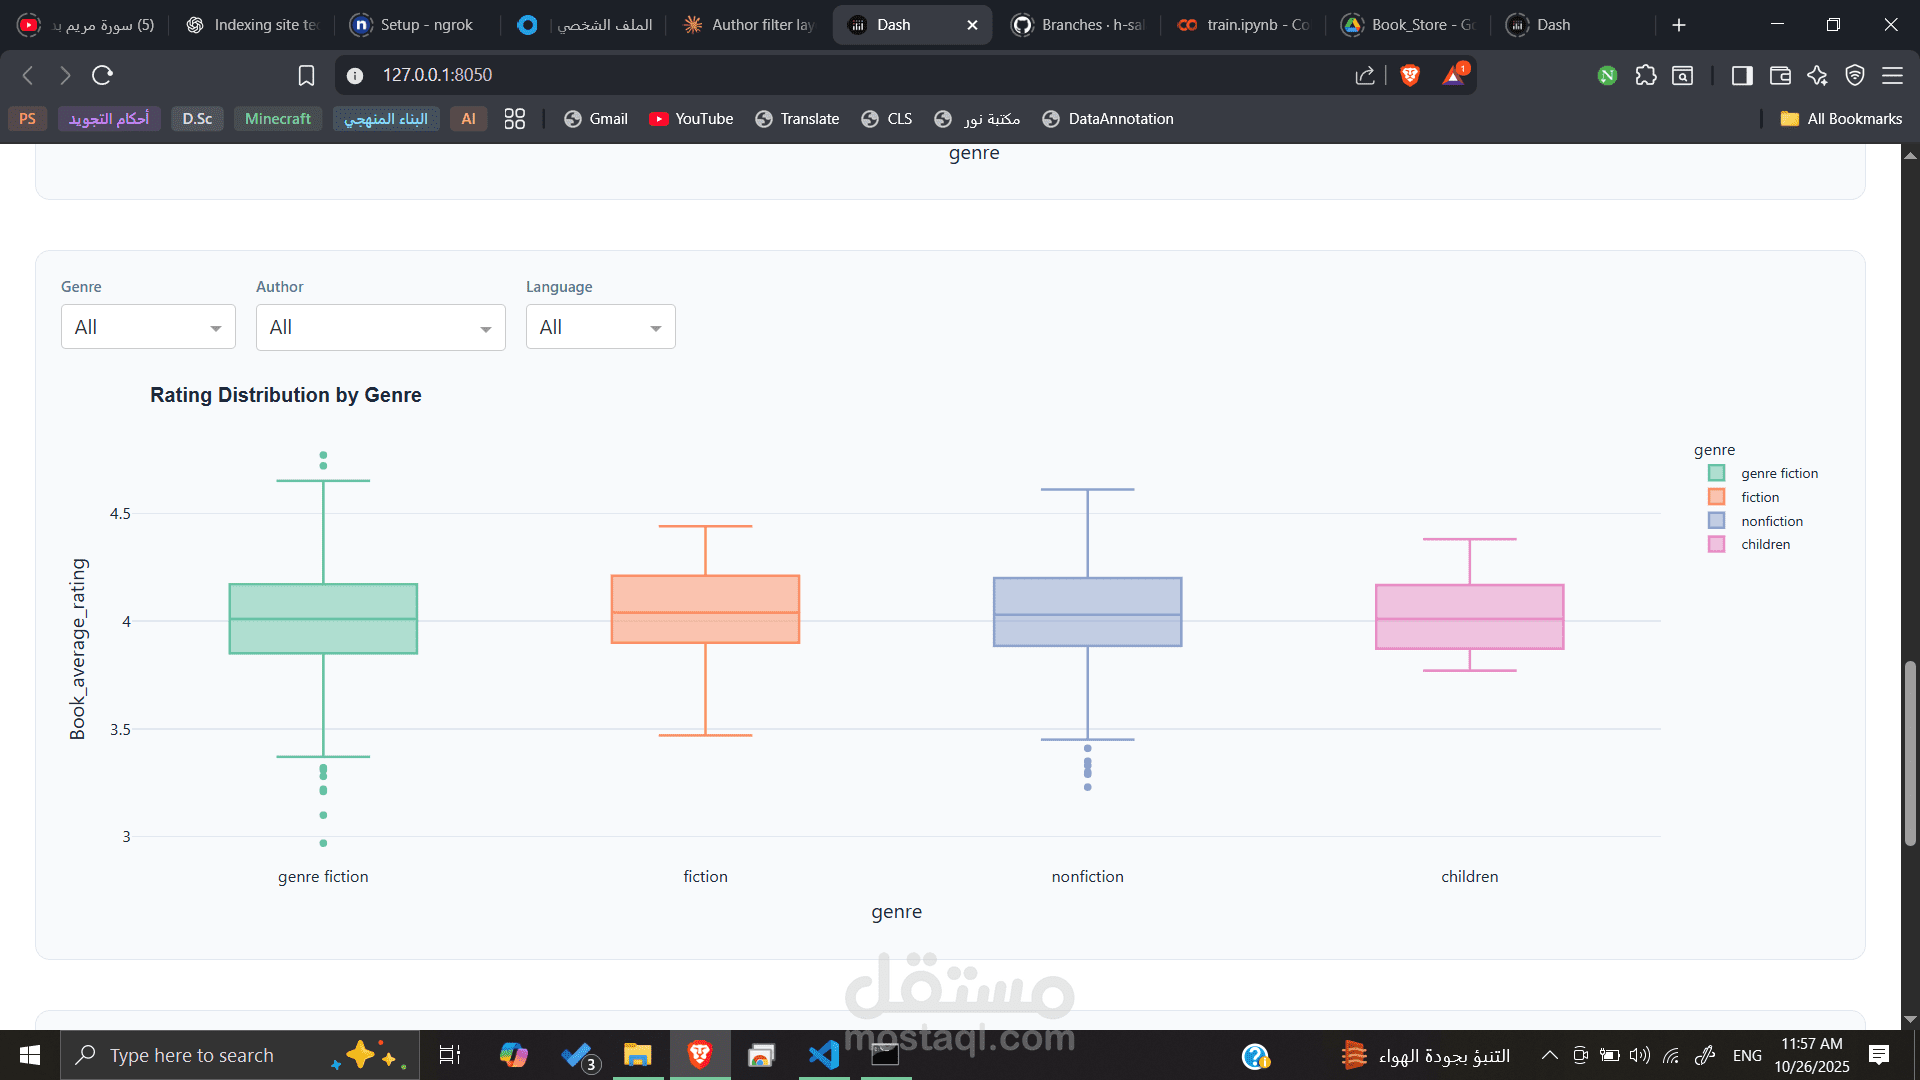
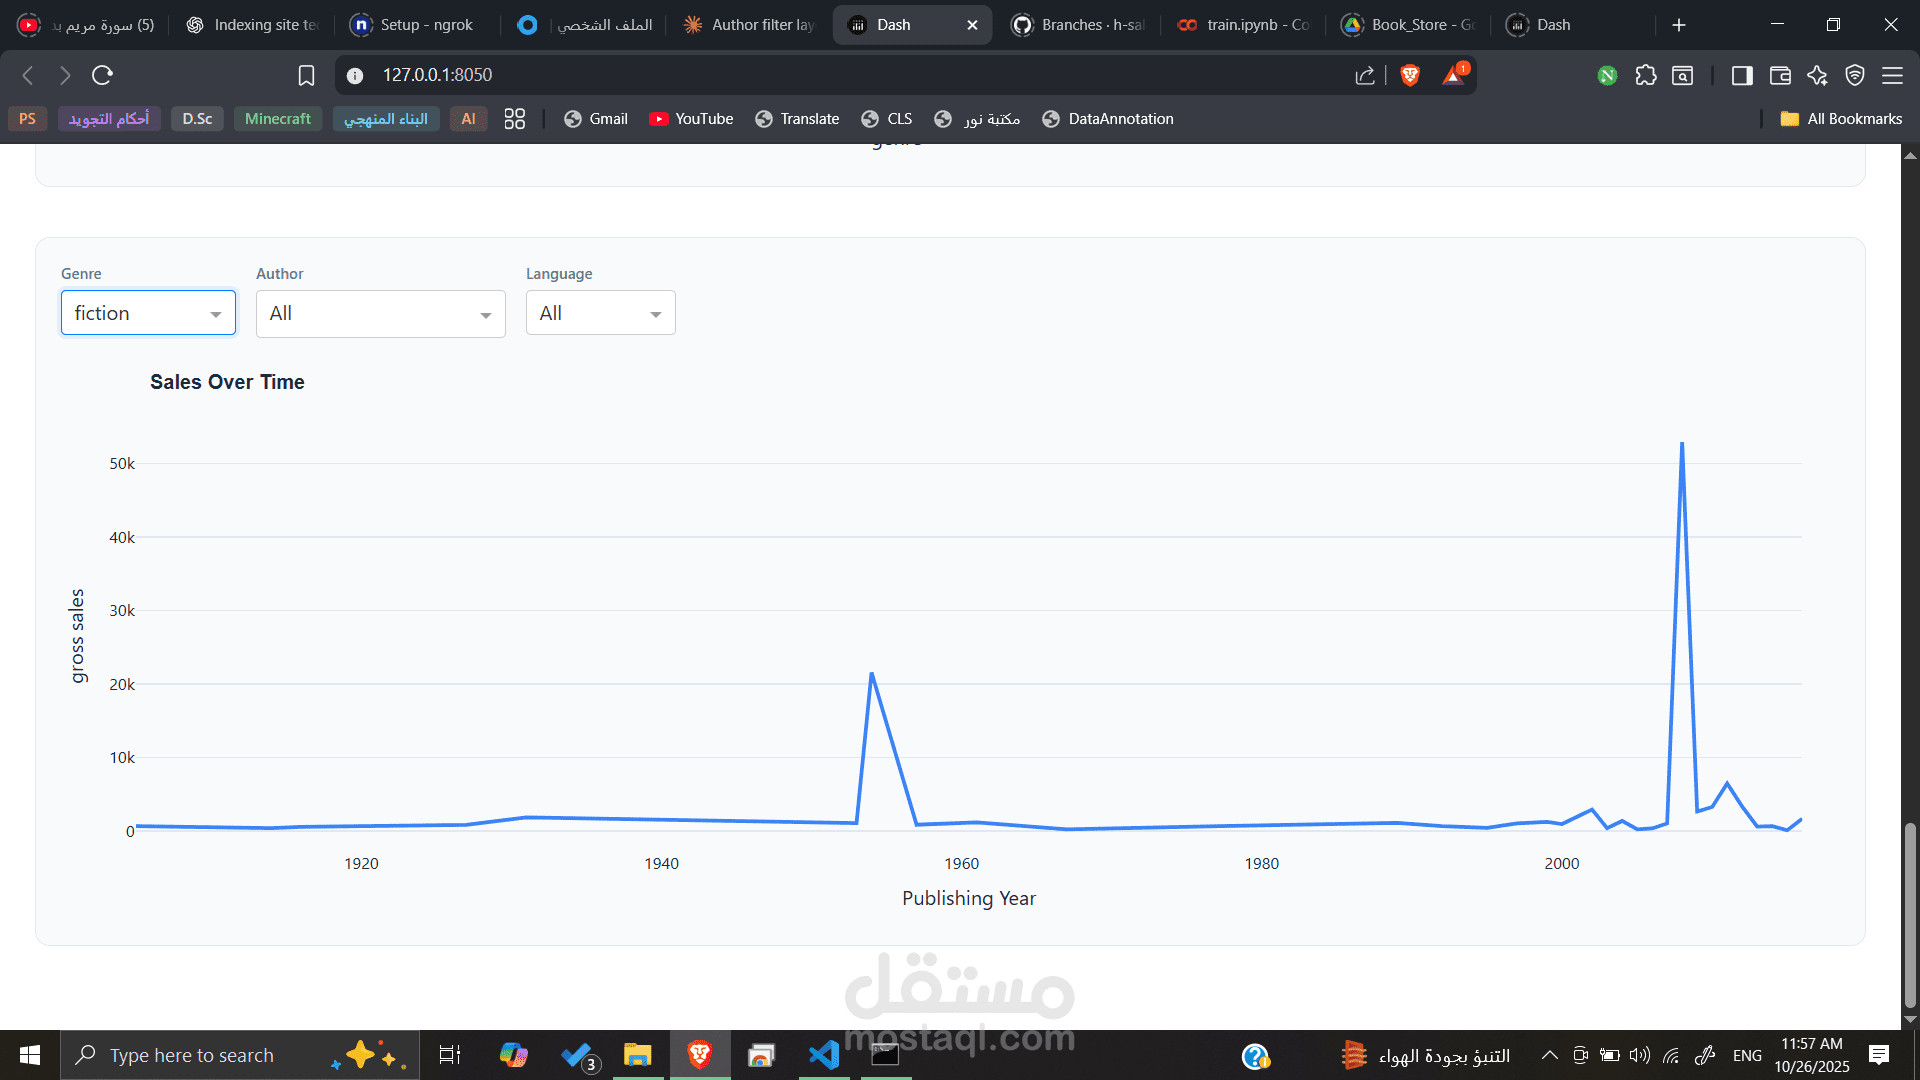
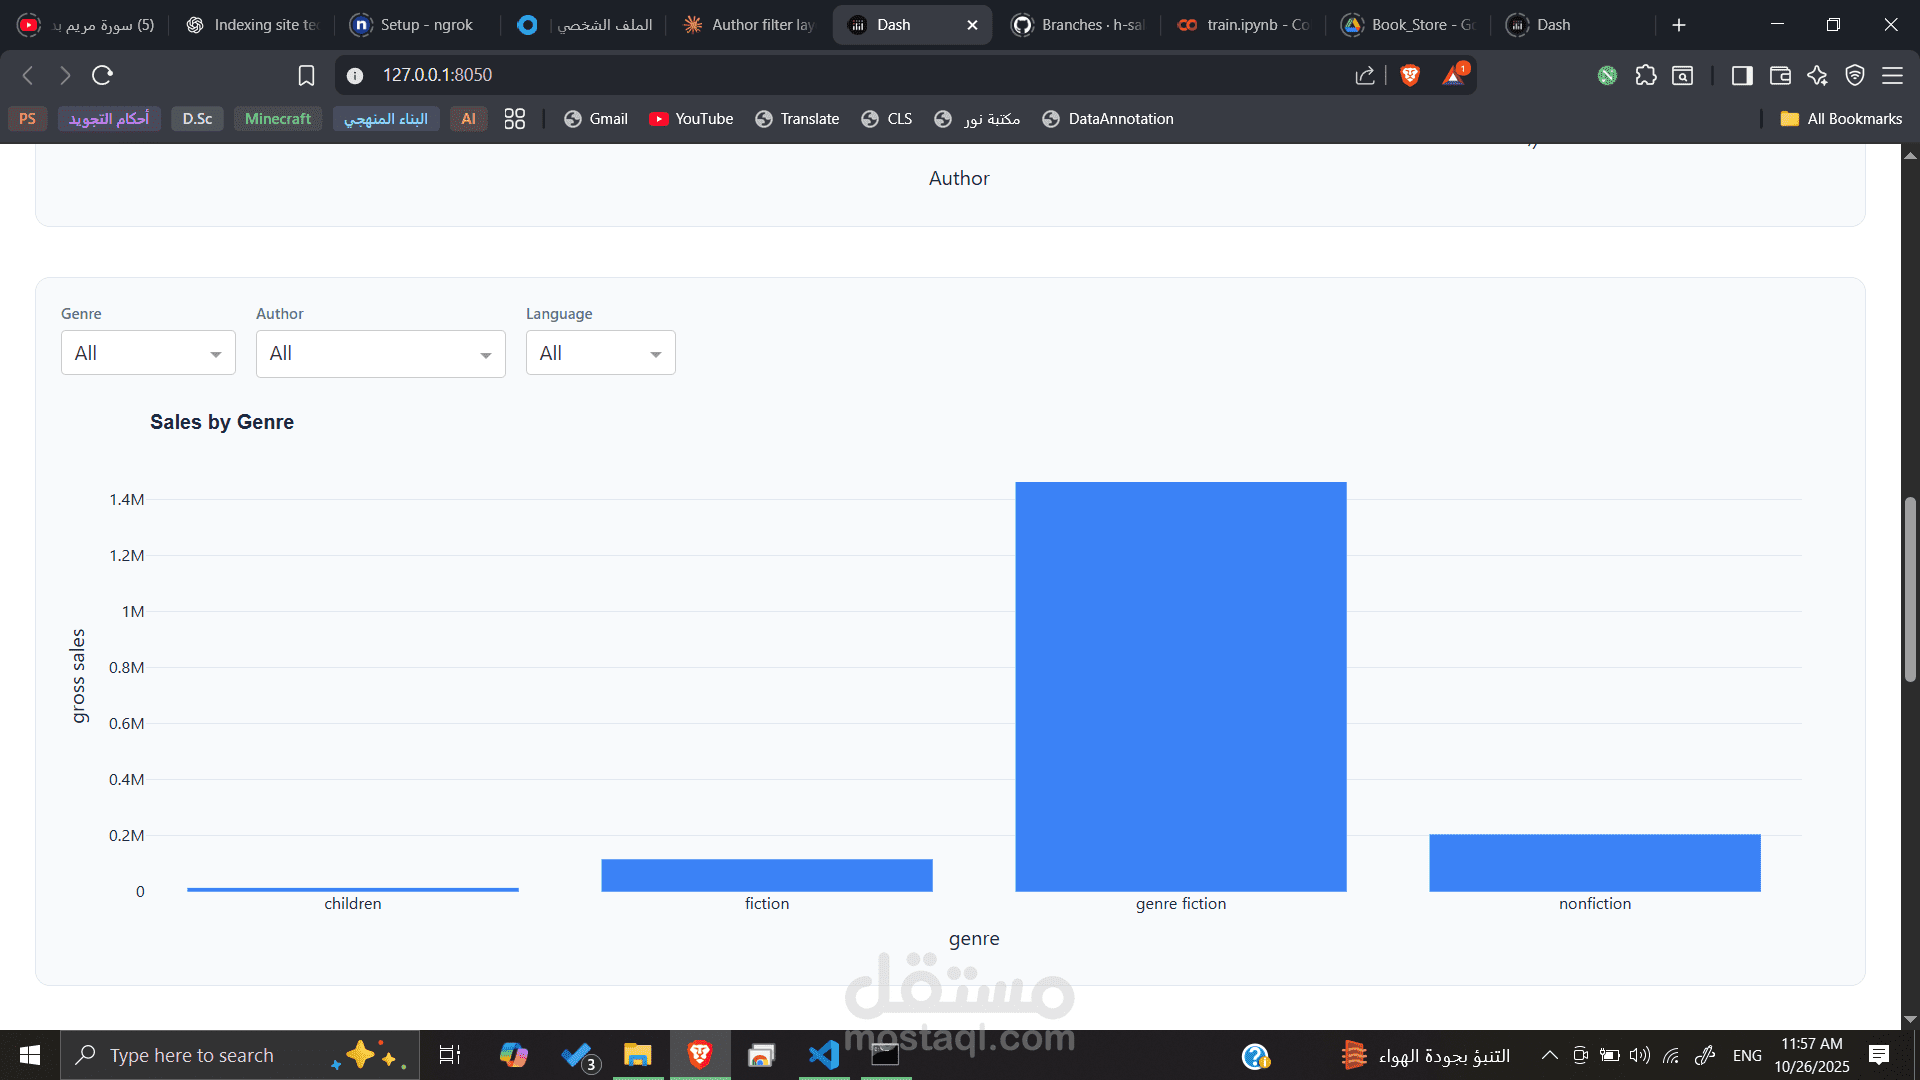
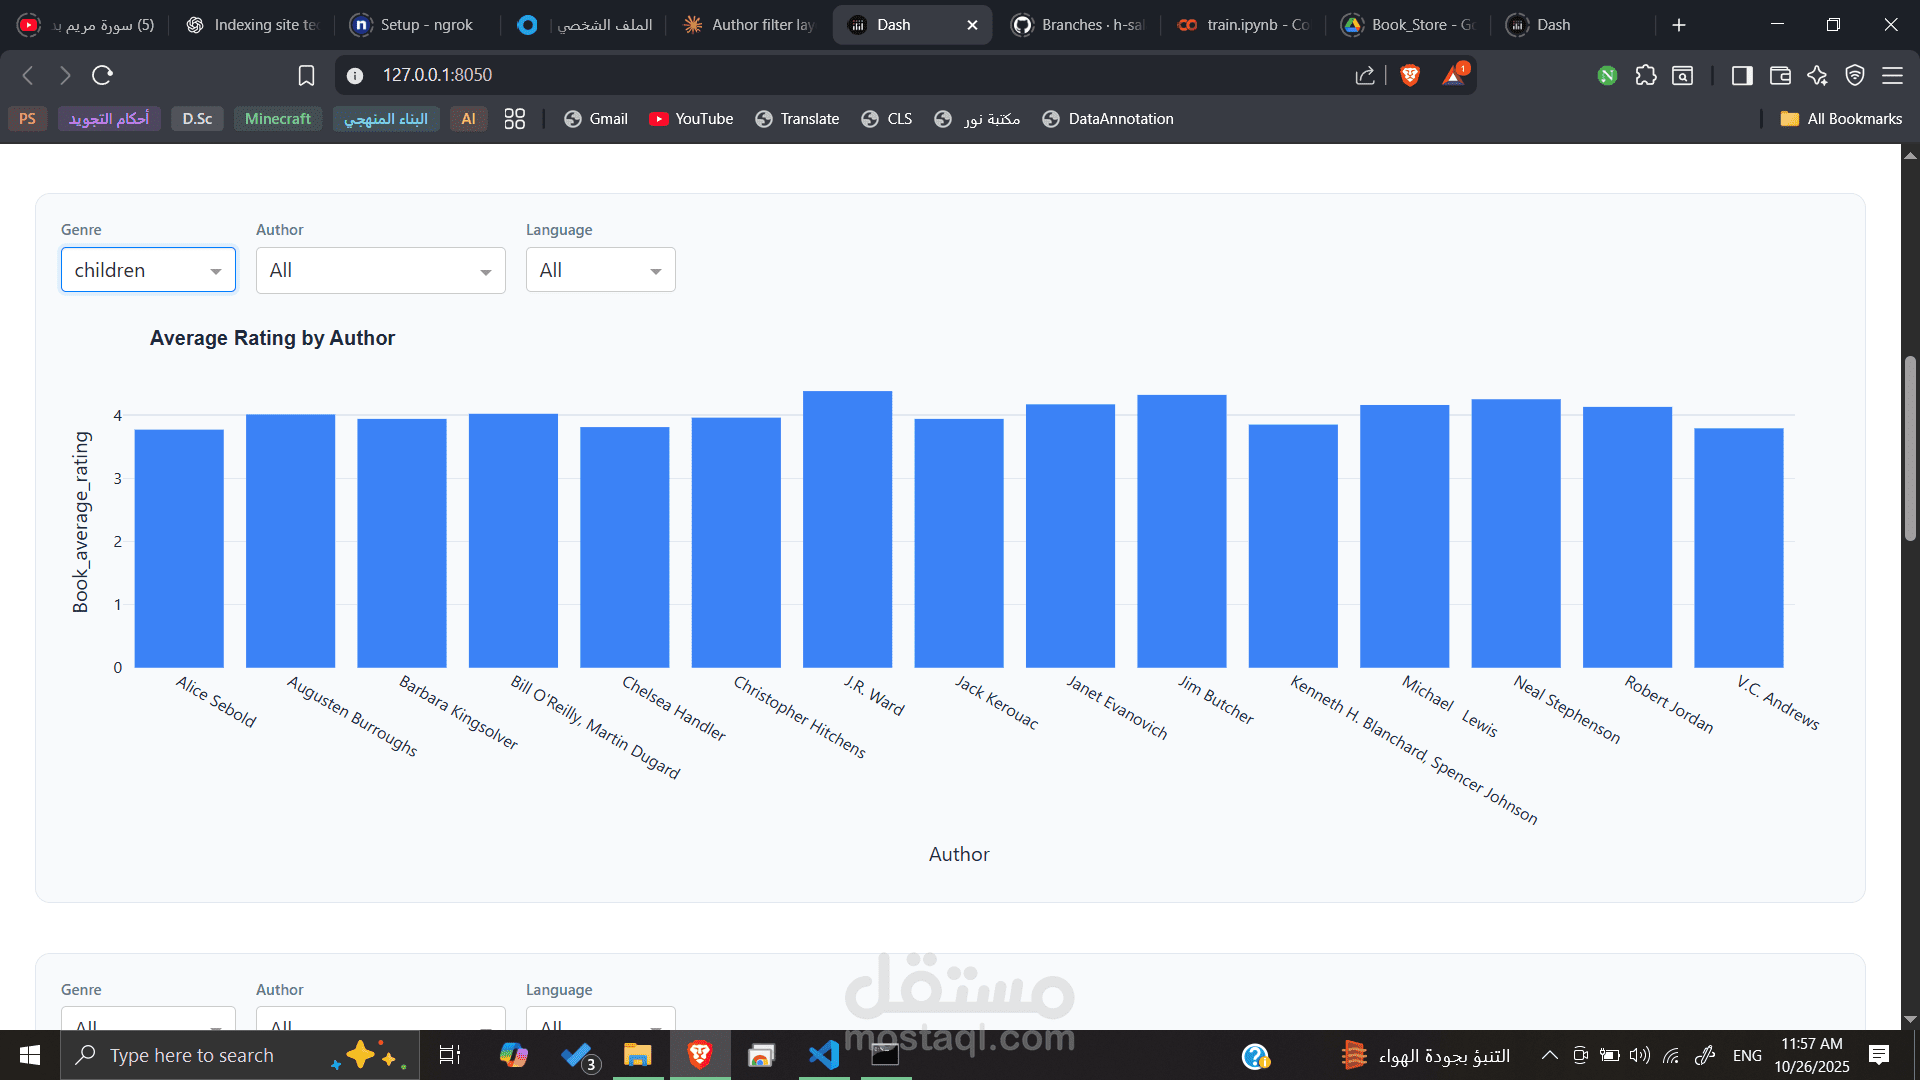
Exploratory Data Analysis (EDA): Visualizing key metrics like publisher revenue, book ratings vs. sales, top authors, and genre performance using Plotly.
Interactive Dashboard (Dash): A web application allowing users to filter charts by genre, author, and language, with dynamic layouts and themes, providing insights into book sales and rating trends.