Sales Report Analysis
تفاصيل العمل
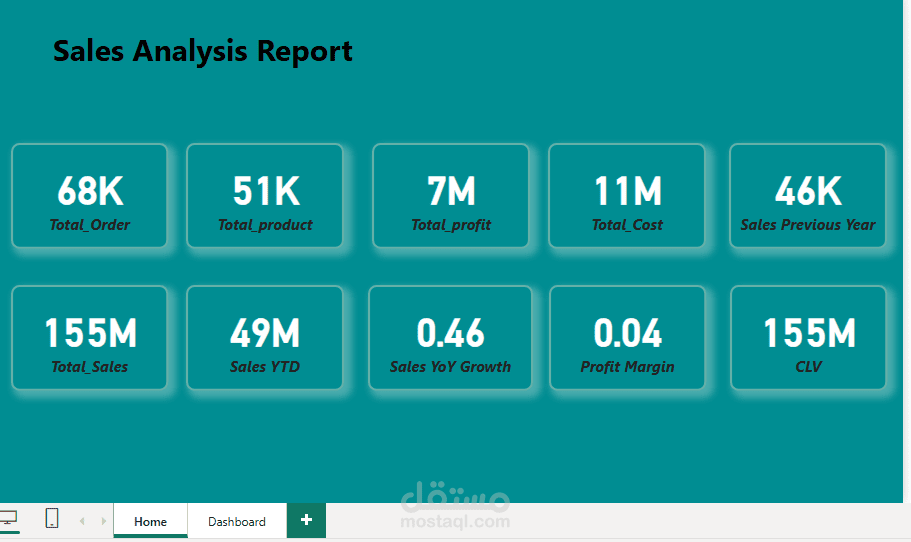

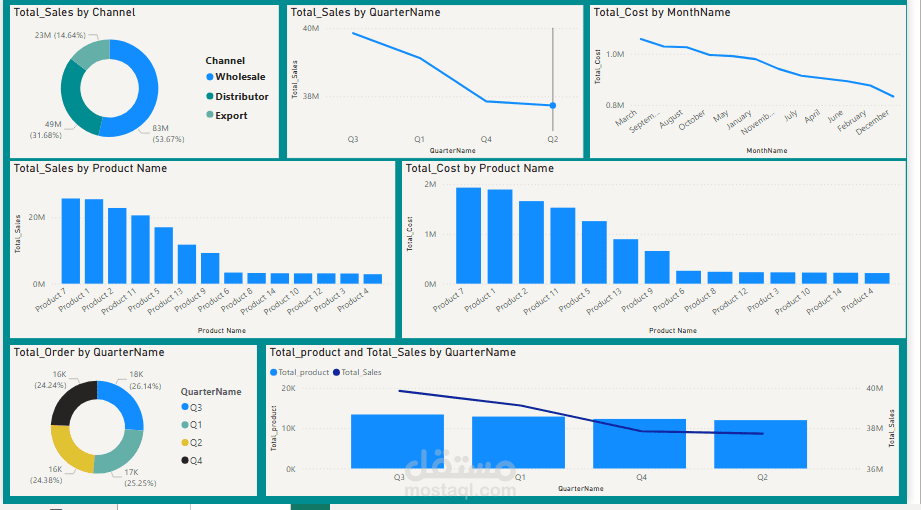
Sales Analysis Report – Power BI Project
This dashboard provides a comprehensive overview of sales performance using Power BI. It summarizes key business metrics to help stakeholders quickly assess profitability, growth, and overall efficiency.
Key Insights Displayed:
Total Orders: 68K – represents total customer transactions.
Total Products: 51K – reflects product diversity and sales distribution.
Total Profit: 7M – net profit after total cost.
Total Cost: 11M – total operational and product costs.
Sales (Previous Year): 46K – benchmark for year-over-year comparison.
Total Sales: 155M – cumulative sales revenue.
Sales YTD (Year to Date):49M – ongoing performance within the current