Addidas Shop Dashboard
تفاصيل العمل
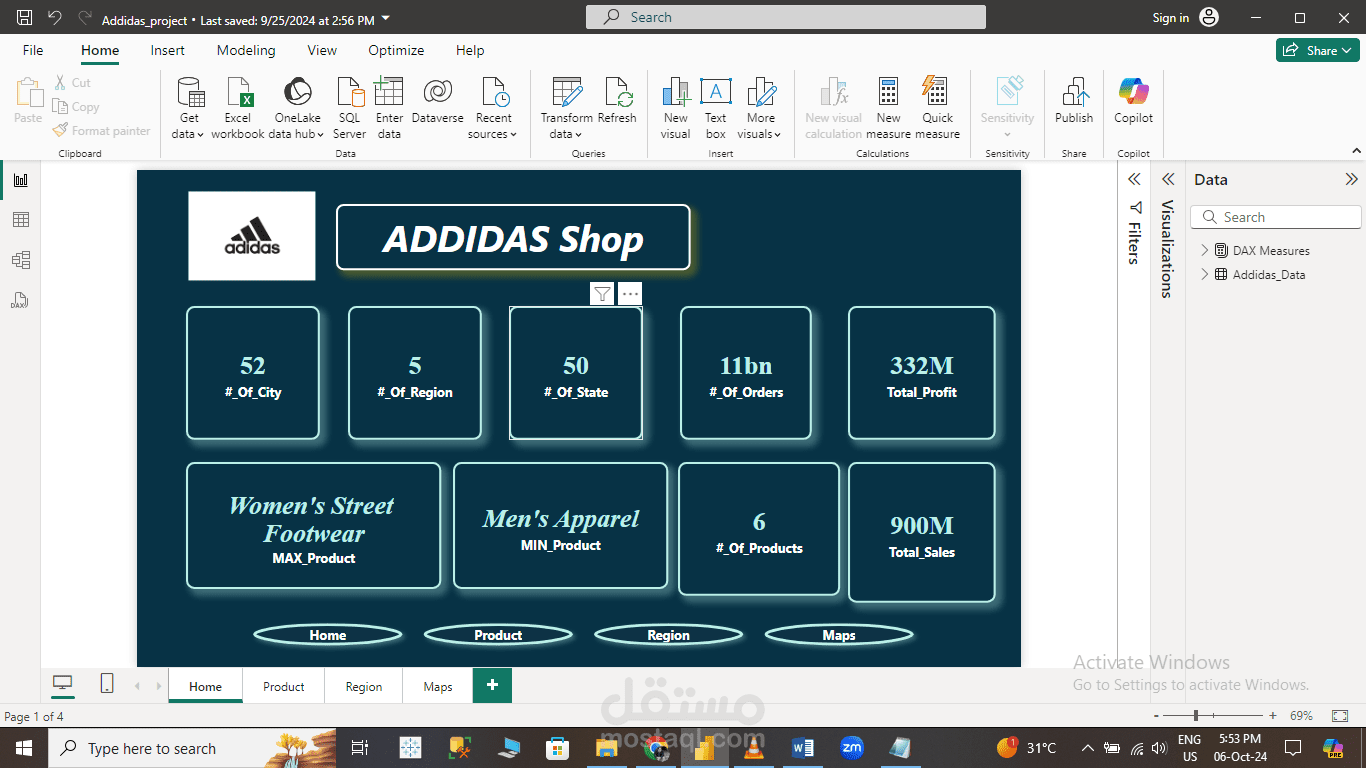
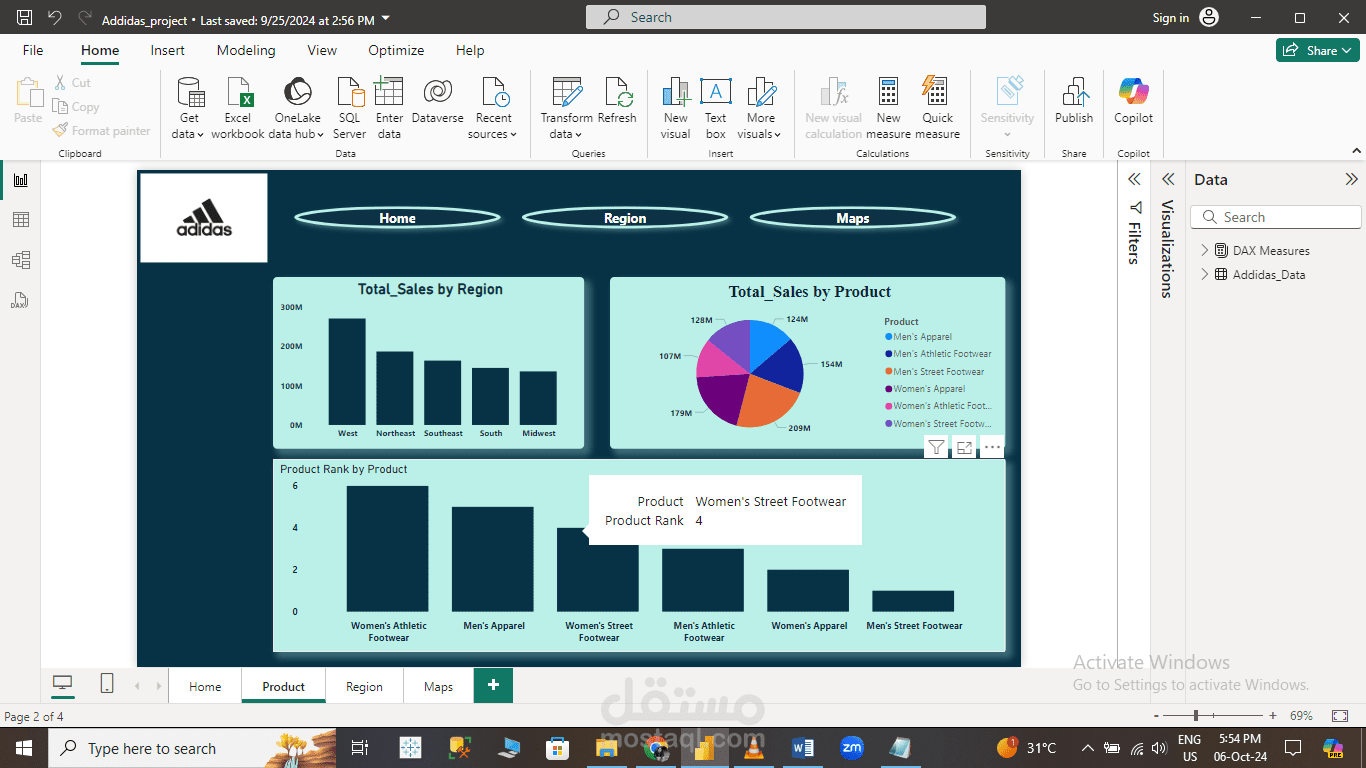
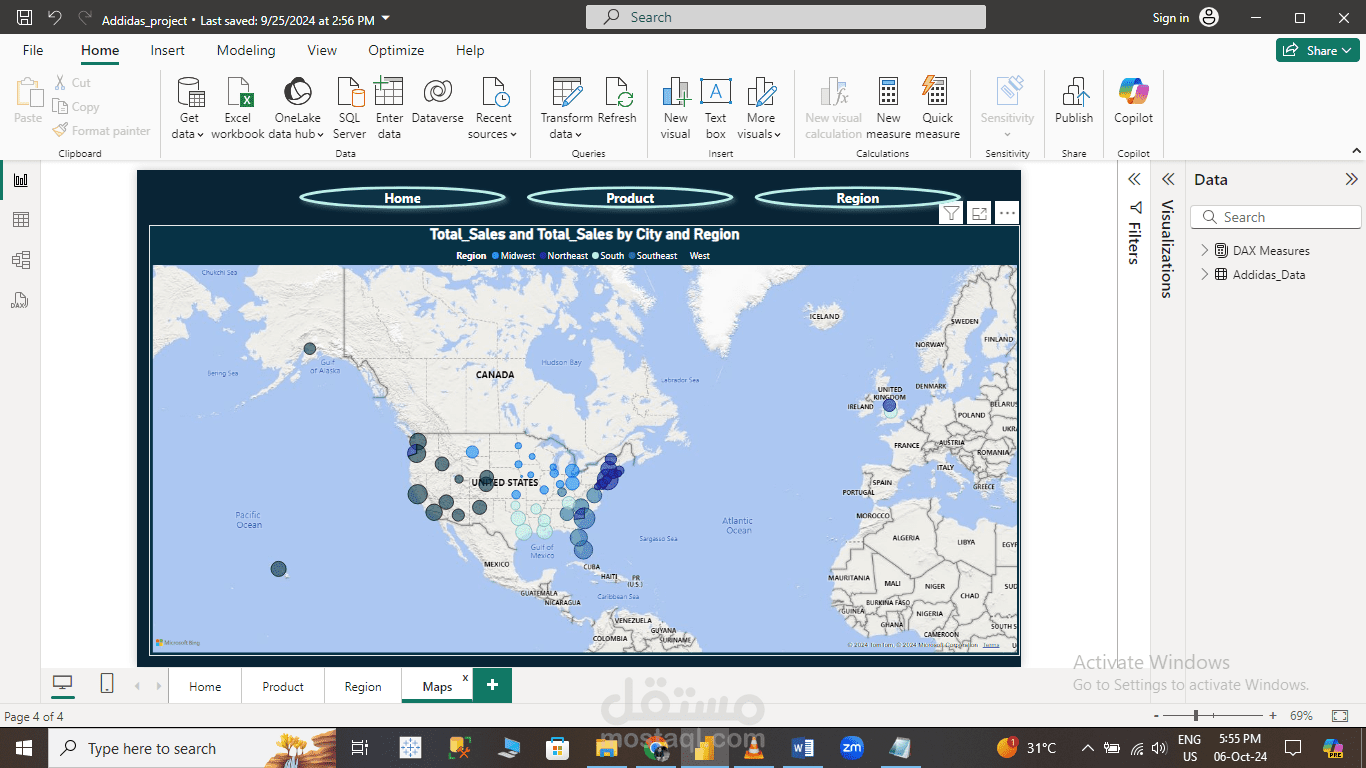
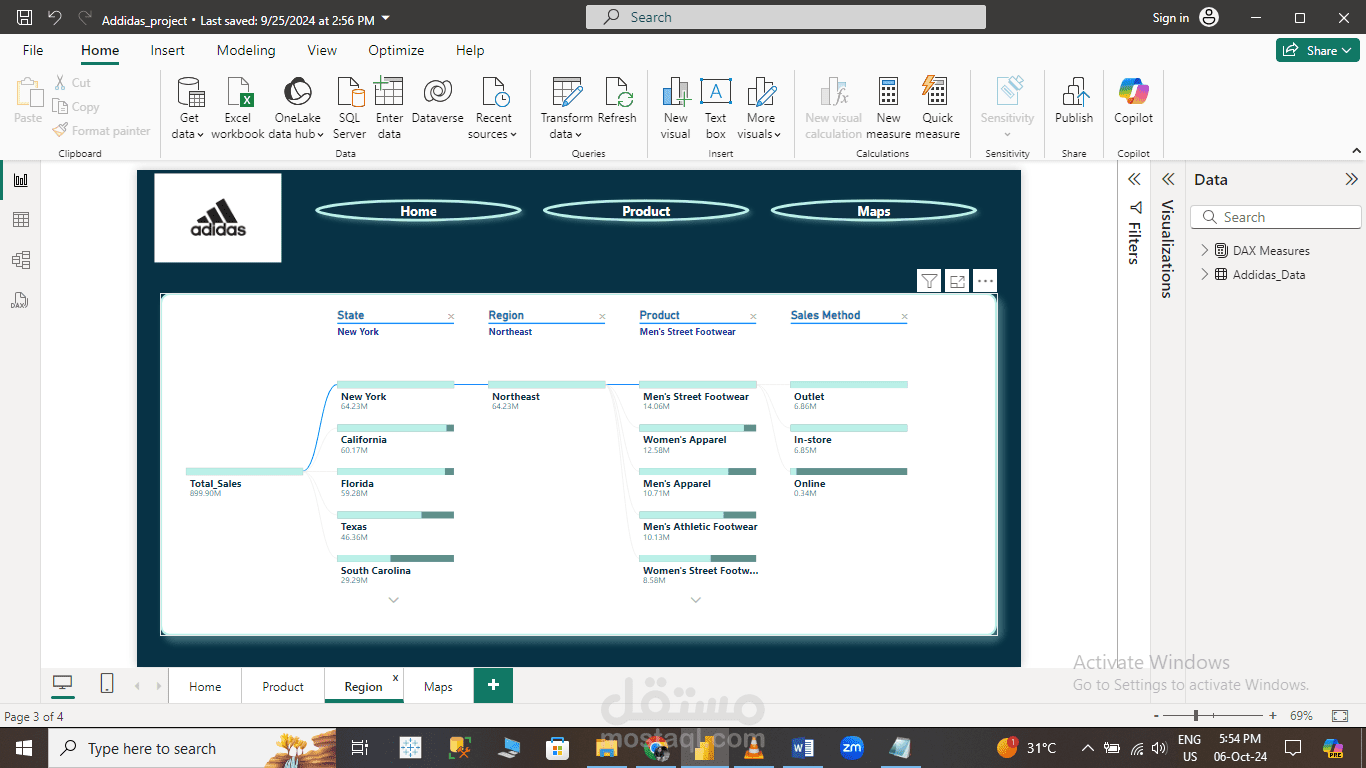
This project showcases an interactive Power BI Dashboard developed to analyze the sales performance of an Adidas Shop. The dashboard provides insights into sales trends, product performance, regional analysis, and customer behavior through various DAX measures and interactive visuals like Maps and Decomposition Trees.
The dataset includes several important tables and is broken into the following key areas:
Product Analysis: Types of Adidas products and their sales performance.
Region Analysis: Sales trends based on geographic regions.
Maps: A geographical breakdown of sales performance by region.
Home: A summary view of the overall sales performance.