Predicting Diabetes Onset: A Logistic Regression Analysis with SMOTE and PCA
تفاصيل العمل
Type of Work
This project is a classic example of a supervised machine learning classification task. The core objective is to build a predictive model that can automatically diagnose whether a patient is likely to have diabetes based on a set of clinical and demographic measurements. It falls under the domain of healthcare analytics and predictive diagnostics, demonstrating a standard end-to-end data science workflow. The work is implemented as an analytical narrative within a Jupyter Notebook, which is an interactive computing environment ideal for combining code, visualizations, and textual explanations to document the entire process from data exploration to model evaluation.
Key Features of the Project
The project's workflow is defined by several key features that represent fundamental steps in a machine learning pipeline. It begins with data exploration, where the dataset's structure and basic statistics are examined. A central feature is the iterative model evaluation, where multiple versions of a Logistic Regression model are built and compared. This includes a baseline model, a model with normalized features, and a model trained on data that has been processed to handle class imbalance. The project also incorporates feature engineering techniques, specifically Standardization (a type of normalization), SMOTE for addressing class imbalance, and PCA for dimensionality reduction. Finally, the use of diagnostic metrics like accuracy, precision, recall, F1-score, and confusion matrices is a critical feature for thoroughly assessing each model's performance beyond a single accuracy score.
Implementation of the Work
The implementation follows a logical, step-by-step progression. It starts by loading the diabetes dataset and splitting it into training and testing sets. The first implementation step is creating a baseline model using Logistic Regression on the raw data to establish a performance benchmark. The results, showing 74.7% accuracy but a weakness in identifying diabetic cases, reveal the need for improvement. The next implementation phase involves preprocessing: the features are standardized to ensure they are on a common scale, and SMOTE is applied to the training data to synthetically generate new examples of the minority class (diabetes), thereby balancing the dataset.
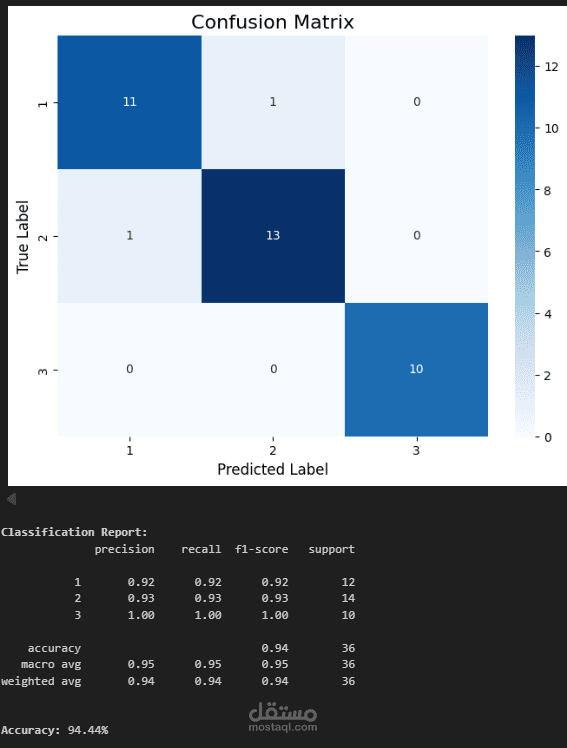
A new model is then trained on this balanced, normalized data. The implementation shows that while overall accuracy dips to 70.8%, the model's recall for the diabetic class improves significantly, demonstrating a crucial trade-off. Finally, dimensionality reduction is implemented using PCA, which transforms the original features into five principal components that capture most of the data's variance. A final model is trained on these components, resulting in a simpler yet similarly performing model. Throughout this process, each model's performance is implemented and evaluated using the same test set, with visualizations like confusion matrix heatmaps providing clear, comparative insights into the strengths and weaknesses of each approach.