Power Bi analysis project
تفاصيل العمل

Power BI Sales & Market Analysis Dashboards
Objective: To design and develop two comprehensive Power BI dashboards showcasing the end-to-end data analysis process, transforming raw store and market data into actionable business insights. The goal was to tell clear stories through data visualization, covering cleaning, exploration, analysis, and visualization steps.
Data Sources:
•Store Data: Included transactional details like store location (City, State, Region), marketing expenditure, and revenue. Initial data required significant cleaning due to formatting inconsistencies and corrupt records after row 150.
•Market Data: Provided context about the market environment, including startup type, company size, market challenges, marketing strategies employed, and years in the market. This data also required cleaning for missing values (Years in Market) and illogical entries (negative Company Size).
Tools: Microsoft Power BI (Power Query for ETL, DAX for analysis, Power BI Desktop for visualization).
Process & Key Steps:
1.Data Preparation & Cleaning (ETL): Imported CSV datasets into Power Query. Identified and addressed data quality issues including inconsistent number formats, illogical values (negative company size), missing data, and corrupt/duplicate records . Applied transformations like filtering rows, correcting data types , renaming columns , and handling missing/erroneous values.
2.Data Modeling: Established a relationship between the cleaned Store and Market tables using the Market ID key to create a coherent data model.
3.Data Exploration: Utilized various visuals (bar charts, scatter plots, maps) interactively with slicers and filters to understand initial trends, patterns, and relationships between variables like marketing spend vs. revenue, and performance across regions.
4.DAX Calculations: Developed DAX measures for key metrics including Total Revenue, Total Marketing Spend, Store Count, Market Count, Average Revenue, and calculated performance indicators like Return on Marketing Spend (ROMS) and Marketing Spend % of Revenue.
5.Dashboard Development: Built two distinct dashboards:
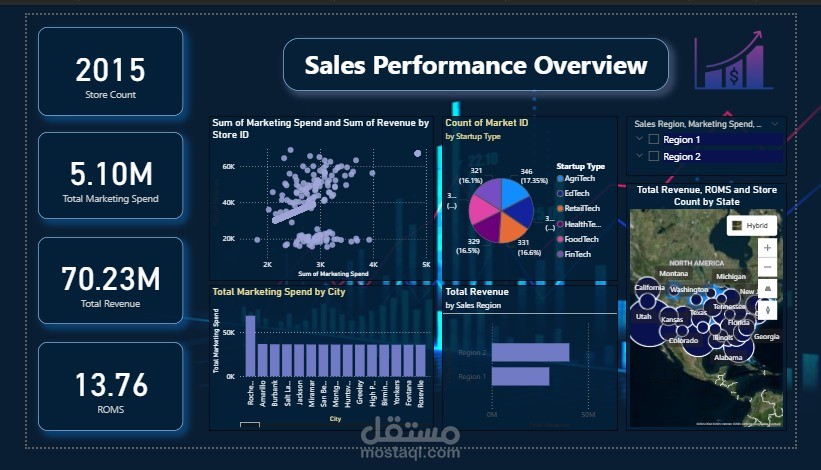
oSales Performance Overview: Focused on overall revenue, marketing spend, geographical performance, and ROMS.
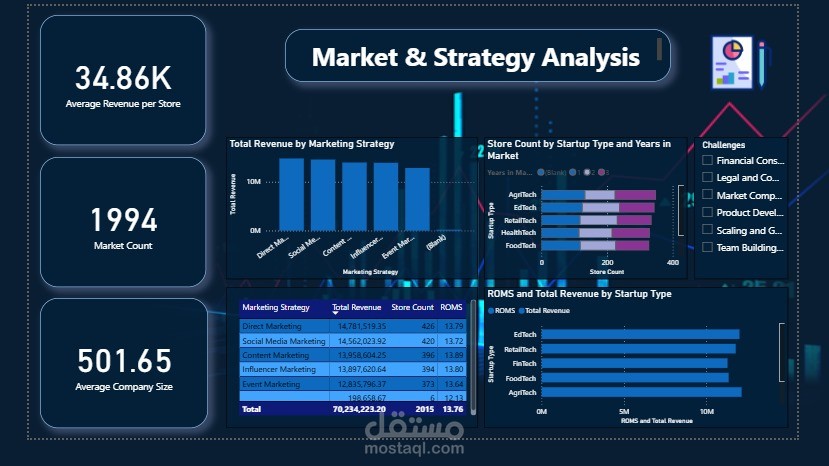
oMarket & Strategy Analysis: Linked market characteristics (Startup Type, Strategy, Challenges) to store performance metrics.
6.Visualization & Storytelling: Selected appropriate visuals to clearly communicate insights. Incorporated titles, text explanations , slicers for interactivity , and ensured a clean, visually balanced layout to tell compelling data stories. Each dashboard included at least 4 visuals and interactive elements.
Deliverable: A Power BI (.pbix) file containing the cleaned data model, DAX measures, and two interactive dashboards designed for business analysis.
Skills Demonstrated:
•Data Cleaning & Transformation (ETL) using Power Query
•Data Modeling & Relationships
•Data Analysis Expressions (DAX) for creating complex measures
•Data Visualization & Dashboard Design Principles
•Interactive Reporting (Slicers, Cross-filtering)
•Data Storytelling
•Problem Solving (Handling dirty data)