تحليل بيانات في مجال السيارات
تفاصيل العمل
Project Overview:
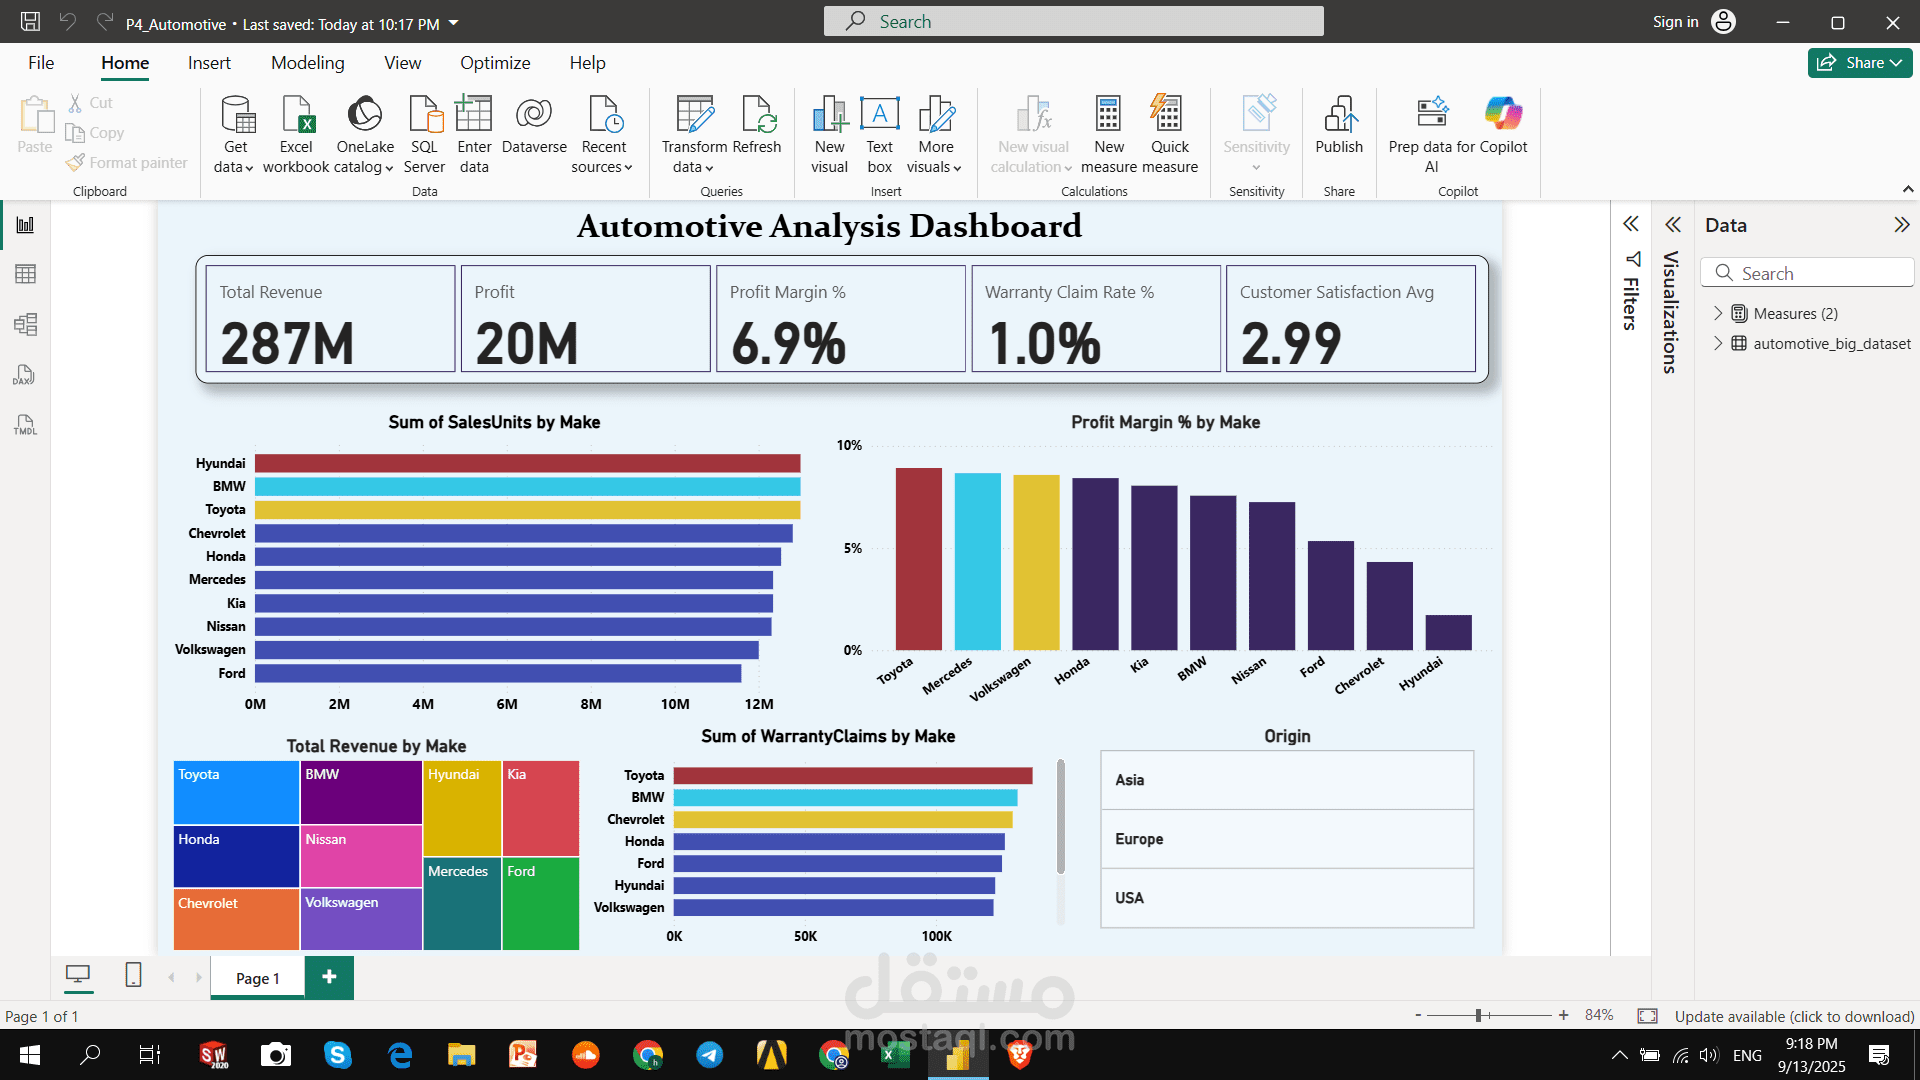
This project focuses on analyzing automotive data to understand vehicle performance, sales trends, and manufacturing quality. The dataset includes details about car models, production numbers, sales regions, and customer satisfaction. The goal is to identify top-performing models, analyze production efficiency, and provide insights for better decision-making in the automotive business.
Dataset Description:
Data Source: Simulated automotive dataset (2023–2024)
Number of Records: ~9,000 entries
Main Fields:
Car ID – Unique identifier for each vehicle model
Brand – Car brand or manufacturer
Model – Car model name
Production Year – Year of manufacture
Units Produced – Number of cars manufactured
Units Sold – Number of cars sold
Price – Average selling price
Region – Market or country where cars were sold
Fuel Type – Petrol, Diesel, Hybrid, or Electric
Customer Rating – Average customer satisfaction score
Defect Rate (%) – Percentage of defective units
? Analysis Goals:
Compare sales and production by brand and model
Identify trends in electric vs. traditional vehicles
Analyze defect rates to improve manufacturing quality
Detect regions with the highest sales potential
Build a Power BI dashboard to visualize key automotive KPIs
️ Tools Used:
Excel / Power BI / Python (Pandas, Matplotlib, Seaborn)
Data Cleaning, Trend Analysis, and Visualization
Deliverables:
Cleaned and structured automotive dataset
Interactive Power BI dashboard with filters (brand, year, fuel type)
Insight report summarizing performance, sales, and quality metrics
نظرة عامة على المشروع:
يهدف هذا المشروع إلى تحليل بيانات صناعة السيارات لفهم أداء الموديلات المختلفة، واتجاهات المبيعات، وجودة التصنيع. يحتوي ملف البيانات على تفاصيل حول العلامات التجارية، وعدد الإنتاج، والمبيعات، ومستوى رضا العملاء. الهدف هو تحديد السيارات الأعلى مبيعًا، وتحليل الكفاءة الإنتاجية، وتقديم رؤى تساعد في اتخاذ قرارات استراتيجية أفضل.
وصف البيانات:
مصدر البيانات: بيانات سيارات افتراضية (2023–2024)
عدد السجلات: حوالي 9,000 سجل
الحقول الأساسية:
Car ID – رقم تعريف السيارة
Brand – العلامة التجارية أو الشركة المصنعة
Model – اسم الموديل
Production Year – سنة التصنيع
Units Produced – عدد السيارات المنتجة
Units Sold – عدد السيارات المباعة
Price – متوسط سعر البيع
Region – الدولة أو السوق الذي تم البيع فيه
Fuel Type – نوع الوقود (بنزين، ديزل، هجين، كهربائي)
Customer Rating – تقييم العملاء
Defect Rate (%) – نسبة العيوب في الإنتاج
? أهداف التحليل:
مقارنة المبيعات والإنتاج بين العلامات التجارية والموديلات
تحليل اتجاهات السيارات الكهربائية مقابل التقليدية
دراسة معدلات العيوب لتحسين الجودة
تحديد الأسواق ذات المبيعات الأعلى
إنشاء لوحة تحكم تفاعلية لعرض مؤشرات الأداء في قطاع السيارات
️ الأدوات المستخدمة:
Excel / Power BI / Python (Pandas, Matplotlib, Seaborn)
تنظيف البيانات، تحليل الاتجاهات، وتمثيل النتائج بصريًا
المخرجات النهائية:
ملف بيانات منظم وجاهز للتحليل
لوحة تحكم تفاعلية بفلاتر (العلامة، السنة، نوع الوقود)
تقرير بالرؤى الرئيسية حول الأداء، المبيعات، والجودة