تحليل بيانات في مجال الصناعه
تفاصيل العمل
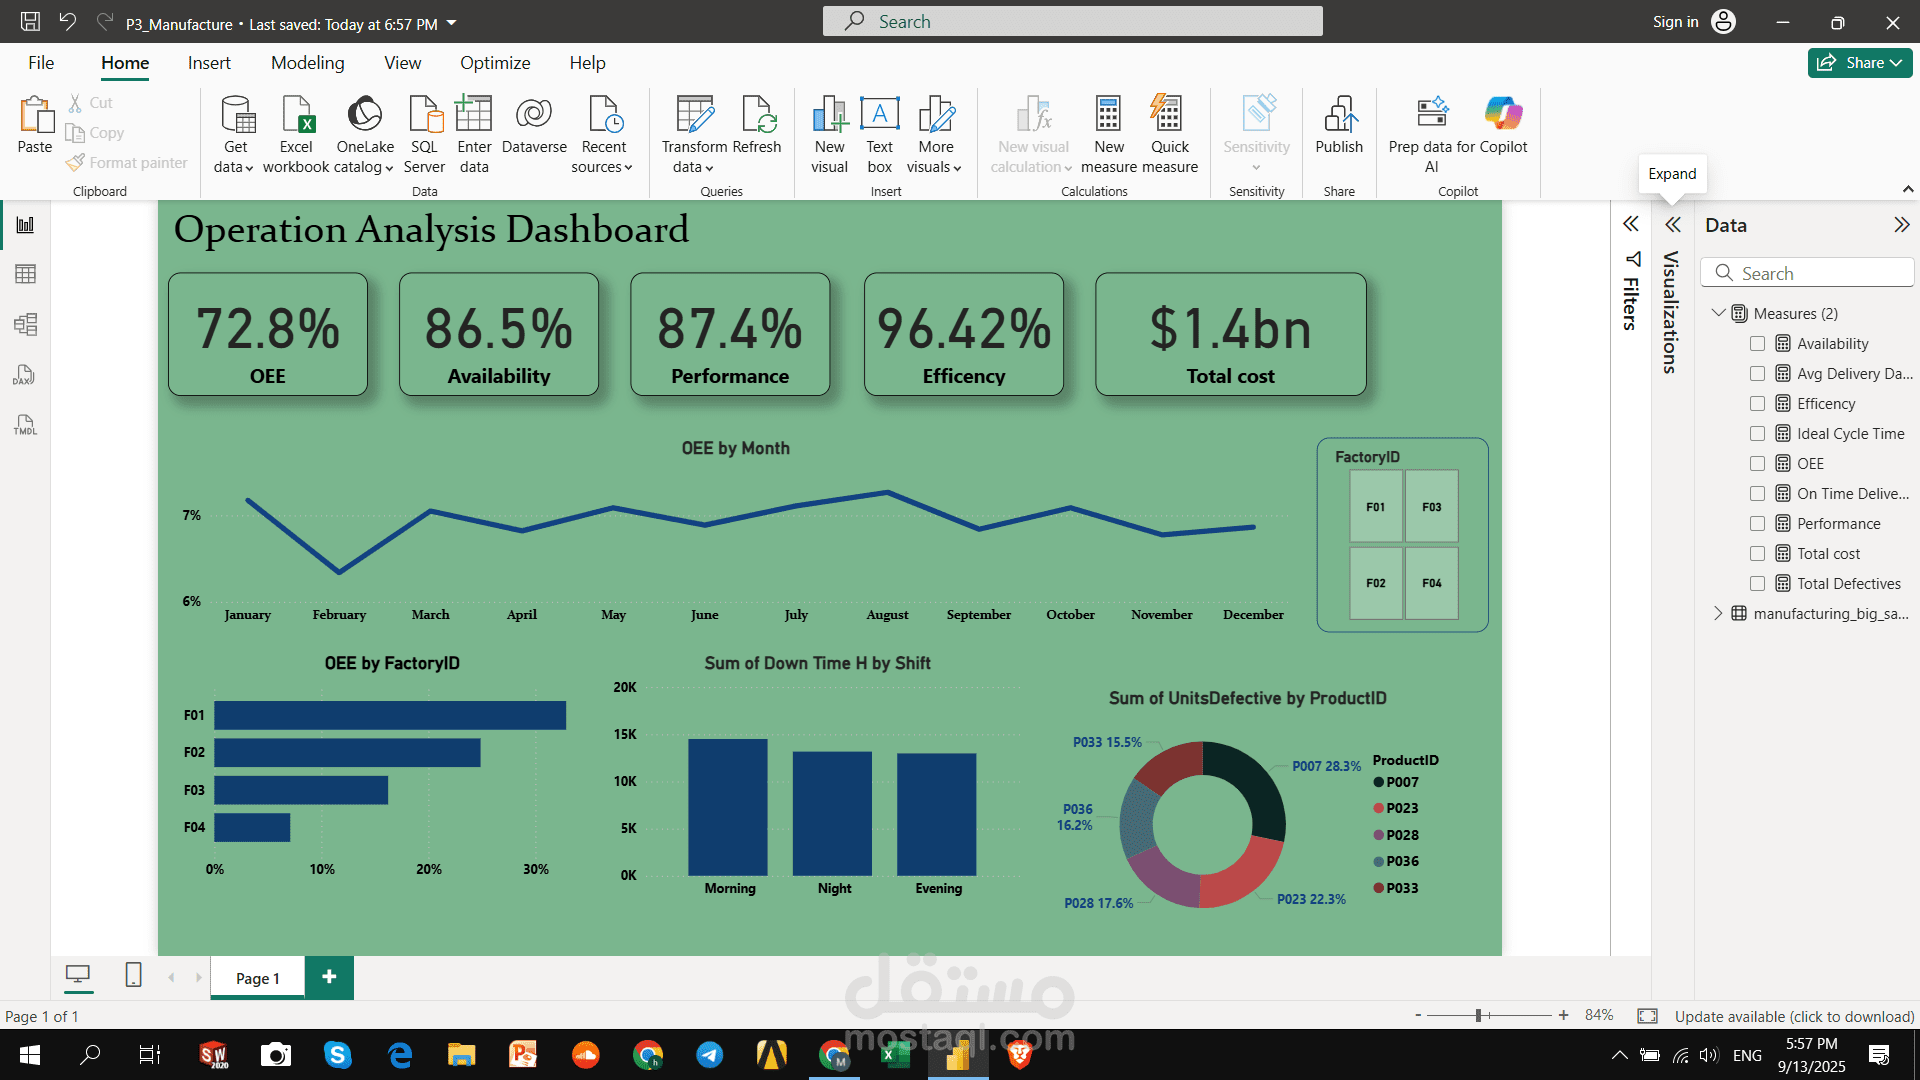
Project Overview:
The goal of this project is to analyze manufacturing data to improve production efficiency, quality control, and cost management. The dataset includes information about production batches, materials, machines, and downtime. The analysis helps identify performance bottlenecks, monitor production trends, and optimize factory operations.
Dataset Description:
Data Source: Simulated manufacturing data (2023–2024)
Number of Records: ~8,000 production entries
Main Fields:
Batch ID – Unique identifier for each production batch
Product Name – Manufactured product name
Production Date – Date of production
Shift – Morning, Evening, or Night
Machine ID – Machine used in production
Operator – Employee responsible for the process
Units Produced – Total units manufactured
Defective Units – Number of defective items
Downtime (hrs) – Machine downtime in hours
Production Cost – Total cost of the batch
Revenue – Sales revenue for the batch
? Analysis Goals:
Measure production efficiency and machine utilization
Identify causes of downtime and defects
Analyze cost vs. revenue per batch
Monitor production performance by shift and operator
Create a Power BI dashboard to visualize KPIs (efficiency, quality, cost)
️ Tools Used:
Excel / Power BI / SQL / Python (Pandas, Matplotlib)
Data Cleaning, Performance Analysis, and Visualization
Deliverables:
Cleaned and formatted manufacturing dataset
Interactive Power BI dashboard
Insight report summarizing productivity trends and recommendations
نظرة عامة على المشروع:
يهدف هذا المشروع إلى تحليل بيانات التصنيع لتحسين كفاءة الإنتاج، ومراقبة الجودة، وتقليل التكاليف. يحتوي ملف البيانات على معلومات حول دفعات الإنتاج، والآلات، والمشغلين، وفترات التوقف. التحليل يساعد في تحديد نقاط الضعف في الأداء وتحسين سير العمل داخل المصنع.
وصف البيانات:
مصدر البيانات: بيانات تصنيع افتراضية (2023–2024)
عدد السجلات: حوالي 8,000 عملية إنتاج
الحقول الأساسية:
Batch ID – رقم تعريف الدفعة
Product Name – اسم المنتج
Production Date – تاريخ الإنتاج
Shift – الوردية (صباحية / مسائية / ليلية)
Machine ID – رقم الآلة
Operator – اسم العامل المسؤول
Units Produced – عدد الوحدات المنتجة
Defective Units – عدد الوحدات المعيبة
Downtime (hrs) – مدة توقف الآلة بالساعات
Production Cost – تكلفة الإنتاج
Revenue – الإيرادات الناتجة عن البيع
? أهداف التحليل:
قياس كفاءة الإنتاج واستخدام الآلات
تحديد أسباب الأعطال ونسب العيوب
تحليل العلاقة بين التكلفة والإيرادات لكل دفعة
مقارنة الأداء بين الورديات والمشغلين
إنشاء لوحة تحكم تفاعلية توضح مؤشرات الأداء الرئيسية (الكفاءة – الجودة – التكلفة)
️ الأدوات المستخدمة:
Excel / Power BI / SQL / Python (Pandas, Matplotlib)
تنظيف البيانات، تحليل الأداء، وتمثيل النتائج بصريًا
المخرجات النهائية:
ملف بيانات نظيف ومنسق
لوحة تحكم تفاعلية بـ Power BI
تقرير بالنتائج والتوصيات لتحسين الكفاءة والجودة