تحليل إحصائي متقدم لسلوك العملاء - Advanced Statistical Analysis of Customer Behavior
تفاصيل العمل

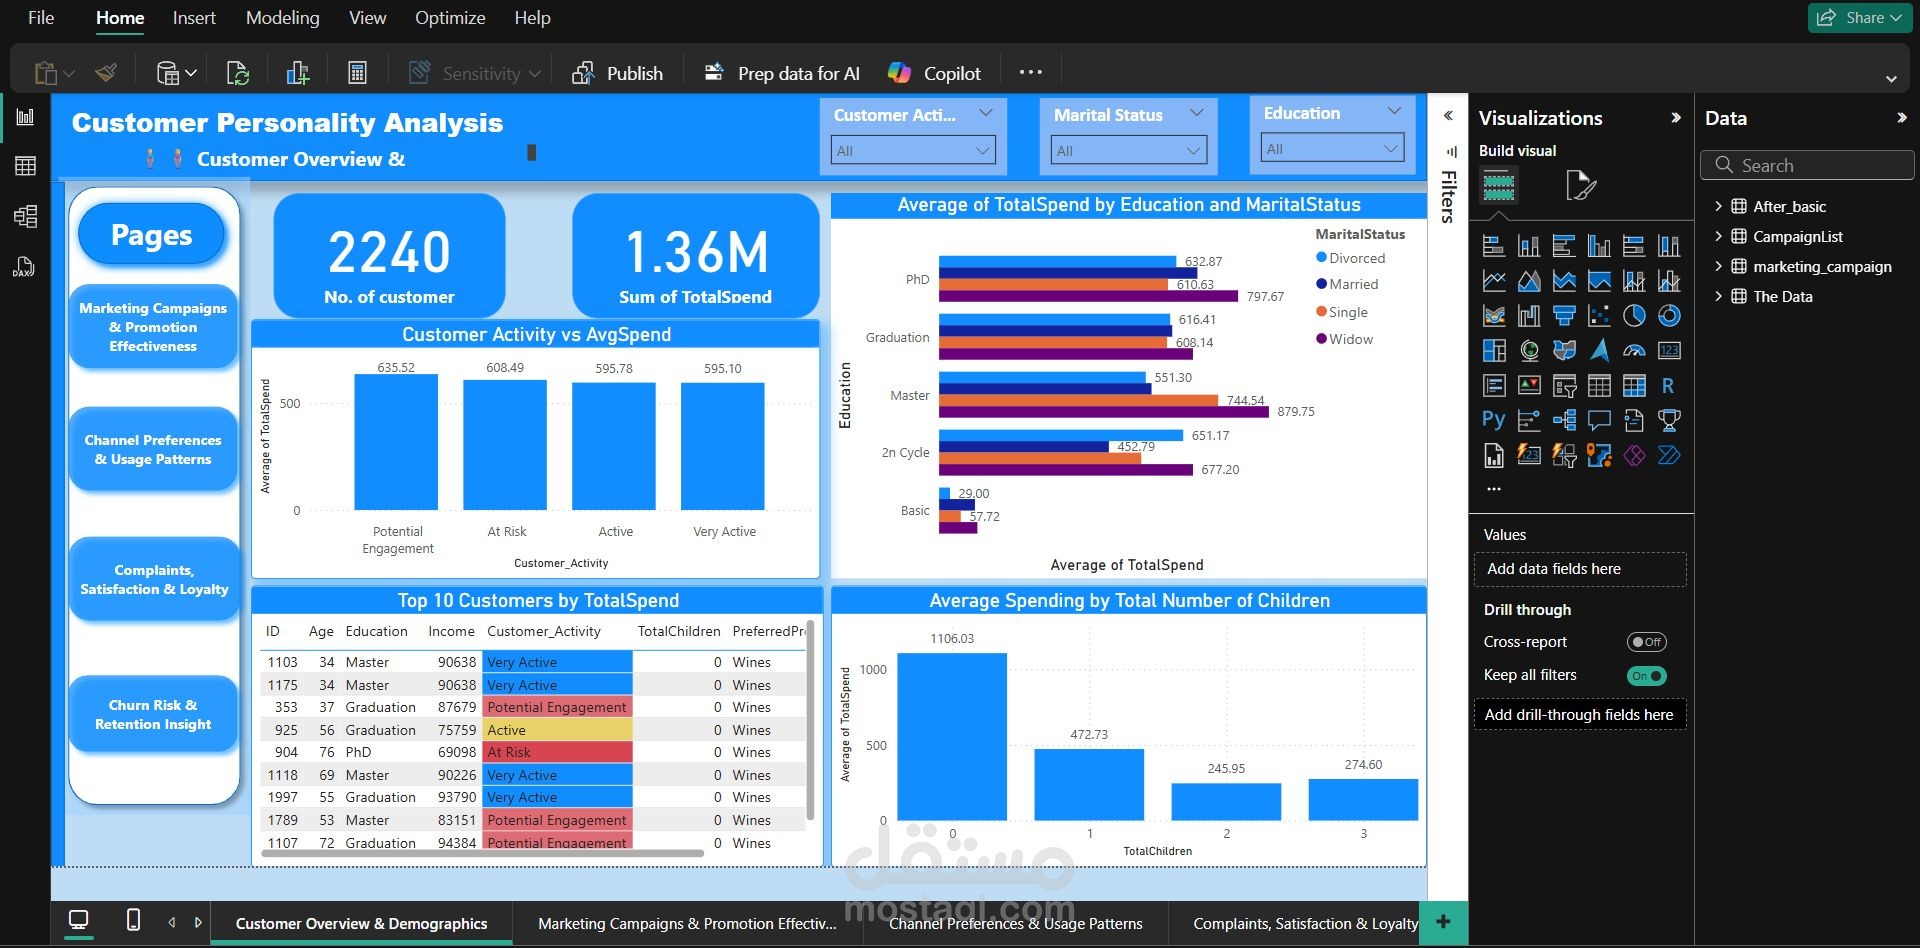
نظرة عامة على المشروع:
يقدّم المشروع نموذجًا متكاملًا لتحليل سلوك العملاء واستجابتهم للحملات التسويقية عبر أدوات تحليلية (SQL, Power BI, R, Excel) لتجزئة العملاء، تقييم الأداء، وتحليل الإنفاق بأسلوب Data Storytelling يربط الرؤى الرقمية بالسياق التجاري لدعم قرارات تسويقية دقيقة وربحية.
الأهداف: تحليل الخصائص الديموغرافية والسلوكية، تحديد العوامل المؤثرة على الإنفاق والاستجابة، تقييم الأداء عبر القنوات، تحليل الشكاوى ومؤشرات الانسحاب، وبناء نموذج انحدار لتوقع الإنفاق المستقبلي.
المنهجية التحليلية:
تحليل الارتباط: أظهر ارتباطًا قويًا بين الدخل والإنفاق (0.819) ومشتريات الكتالوج (0.779) والمتجر (0.675)، وسلبيًا مع عدد الأطفال (-0.499) وزيارات الموقع غير المنتجة (-0.500).
الانحدار المتعدد: نموذج بدقة تفسيرية R²=0.829 يوضح أن الإنفاق يتأثر إيجابيًا بالدخل (+0.013)، الحملات المقبولة (+85.6)، مشتريات الكتالوج (+65.1)، المتجر (+27.1)، الويب (+17.8)، وسلبيًا بعدد الأطفال (-120.3).
التحقق الإحصائي: استُبعدت المتغيرات غير الدالة، ما أكد أن الدخل والسلوك الشرائي أهم محركات الإنفاق.
تجزئة العملاء:
الفئة 31–45 الأعلى تجاوبًا، الحاصلون على درجات جامعية ودكتوراه (+25%)، ذوو الدخل المتوسط إلى العالي (60% من الإنفاق)، والتفاعل المتكرر مع الحملات (>70%).
نماذج العملاء:
كارلا الطموحة (رقمية)، فتحي العائلي (متوسط الدخل)، سالم المحافظ (منخفض النشاط)، لينا الراقية (عالية الولاء).
النتائج:
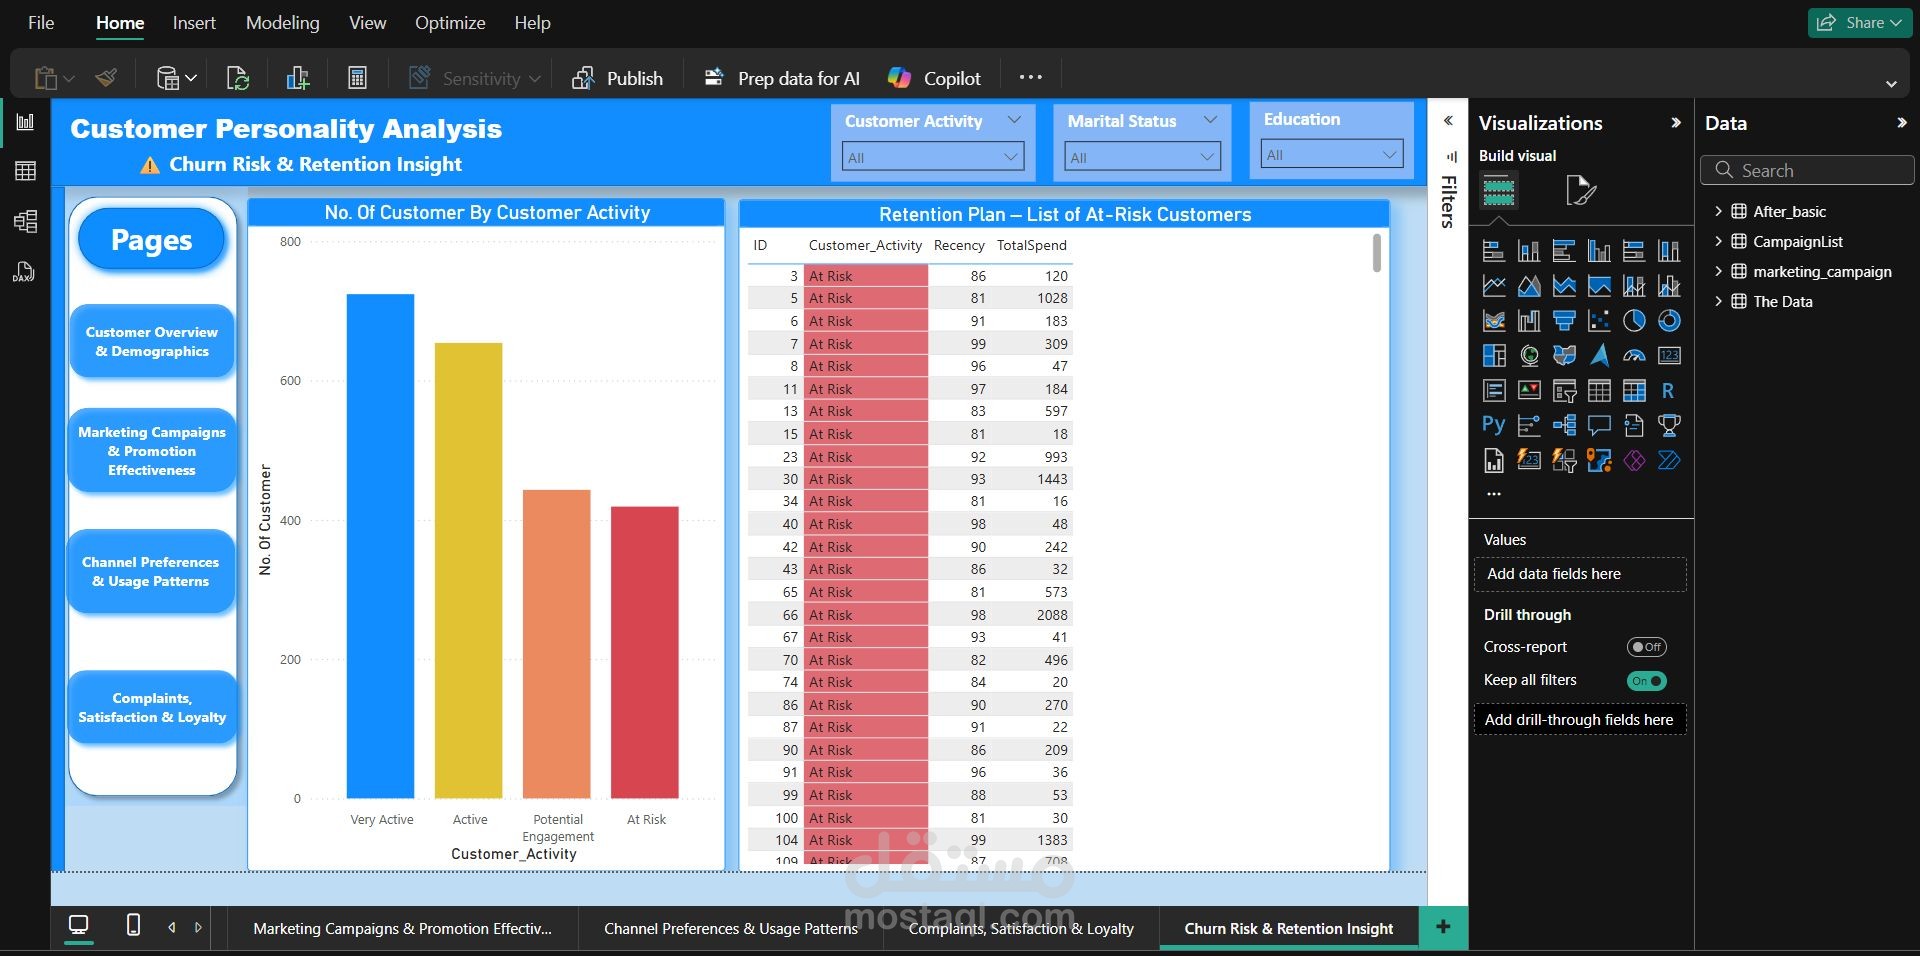
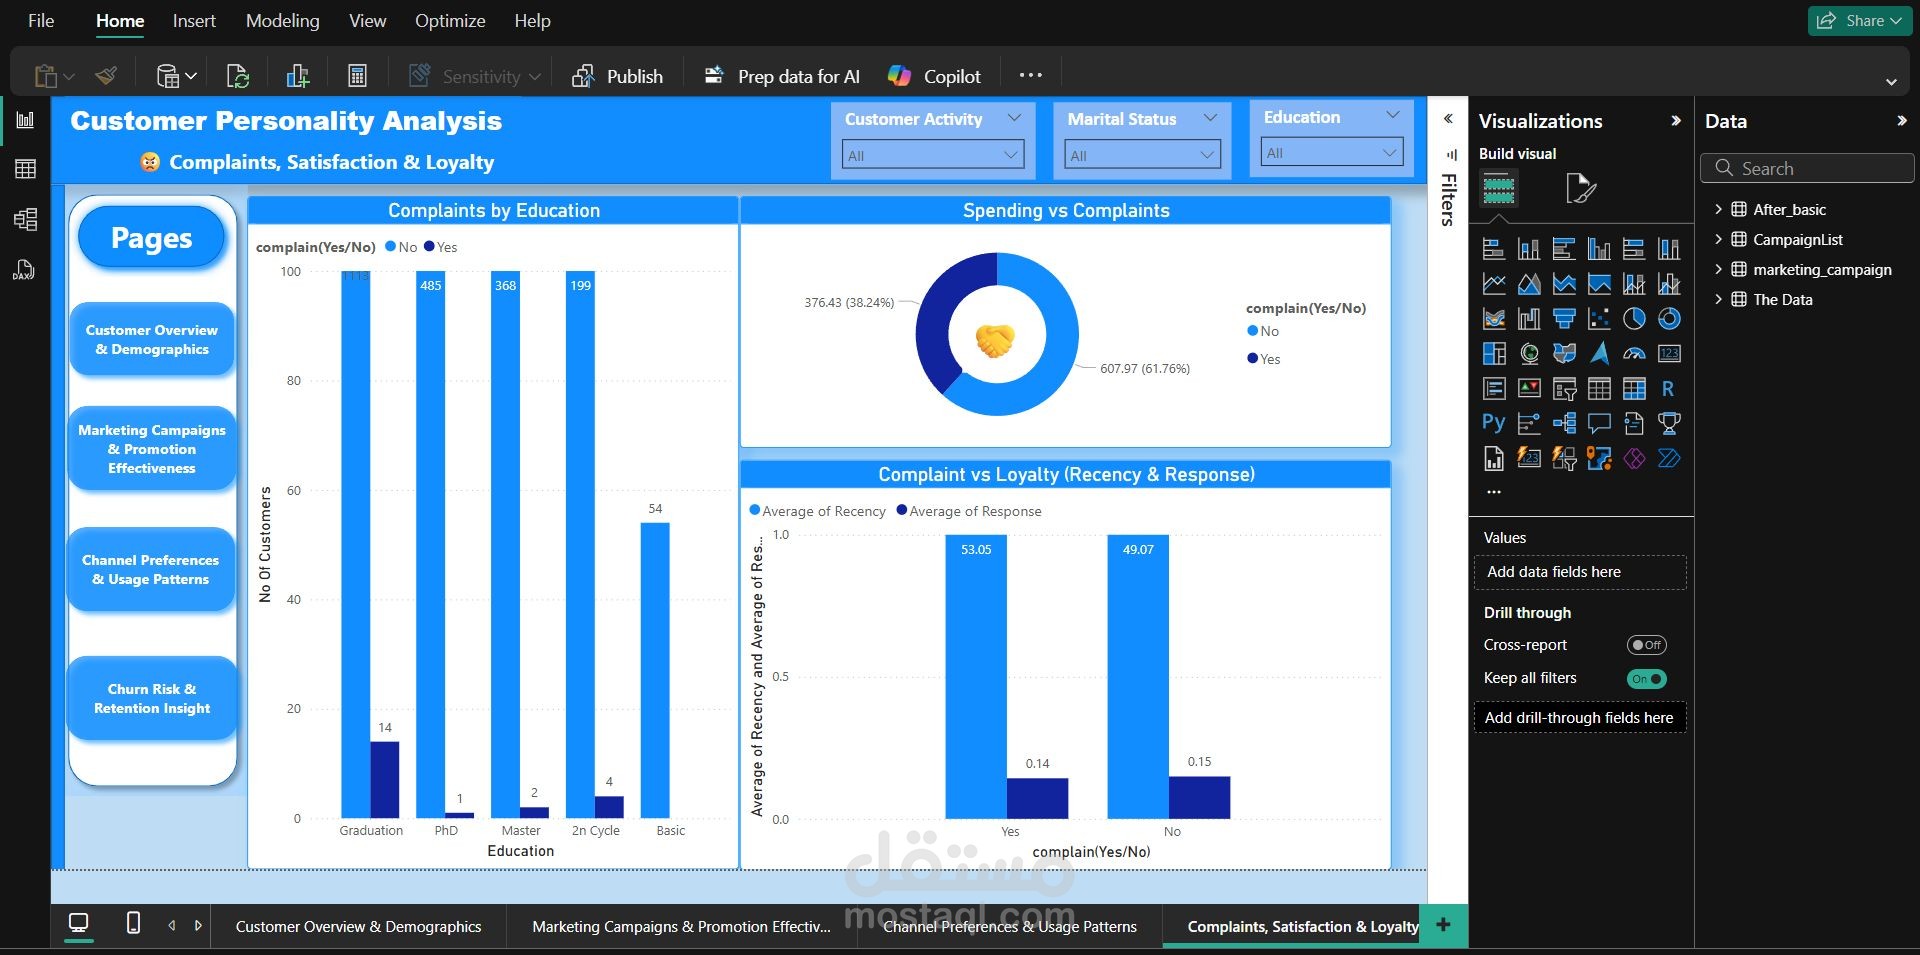
استجابة الهاتف تفوقت بثلاثة أضعاف البريد الإلكتروني، ROI ارتفع إلى 35%، التفاعل مع ≥3 حملات زاد الإنفاق (+40%)، بينما الشكاوى قللت التفاعل (-25%).
التوصيات:
استهداف الشرائح العليا بعروض حصرية، تخصيص الرسائل، تحسين تجربة المتجر والكتالوج، تعزيز الولاء، وتصميم عروض موجهة للأسر وتحسين تجربة الموقع.
الخلاصة:
حقق المشروع تفسيرًا بنسبة 83% للإنفاق الكلي، مؤكدًا فعالية الدمج بين التحليل الإحصائي والسرد البياني في تحسين الأداء التسويقي وتعظيم ROI.
Project Overview:
This project presents an integrated model for analyzing customer behavior and marketing campaign response using analytical tools (SQL, Power BI, R, Excel) to segment customers, evaluate performance, and analyze spending through Data Storytelling that links digital insights with business context to guide precise and profitable marketing decisions.
Objectives: Analyze demographic and behavioral characteristics, identify factors influencing spending and campaign response, assess performance across channels, analyze complaints and churn indicators, and build a regression model to predict future spending.
Analytical Methodology:
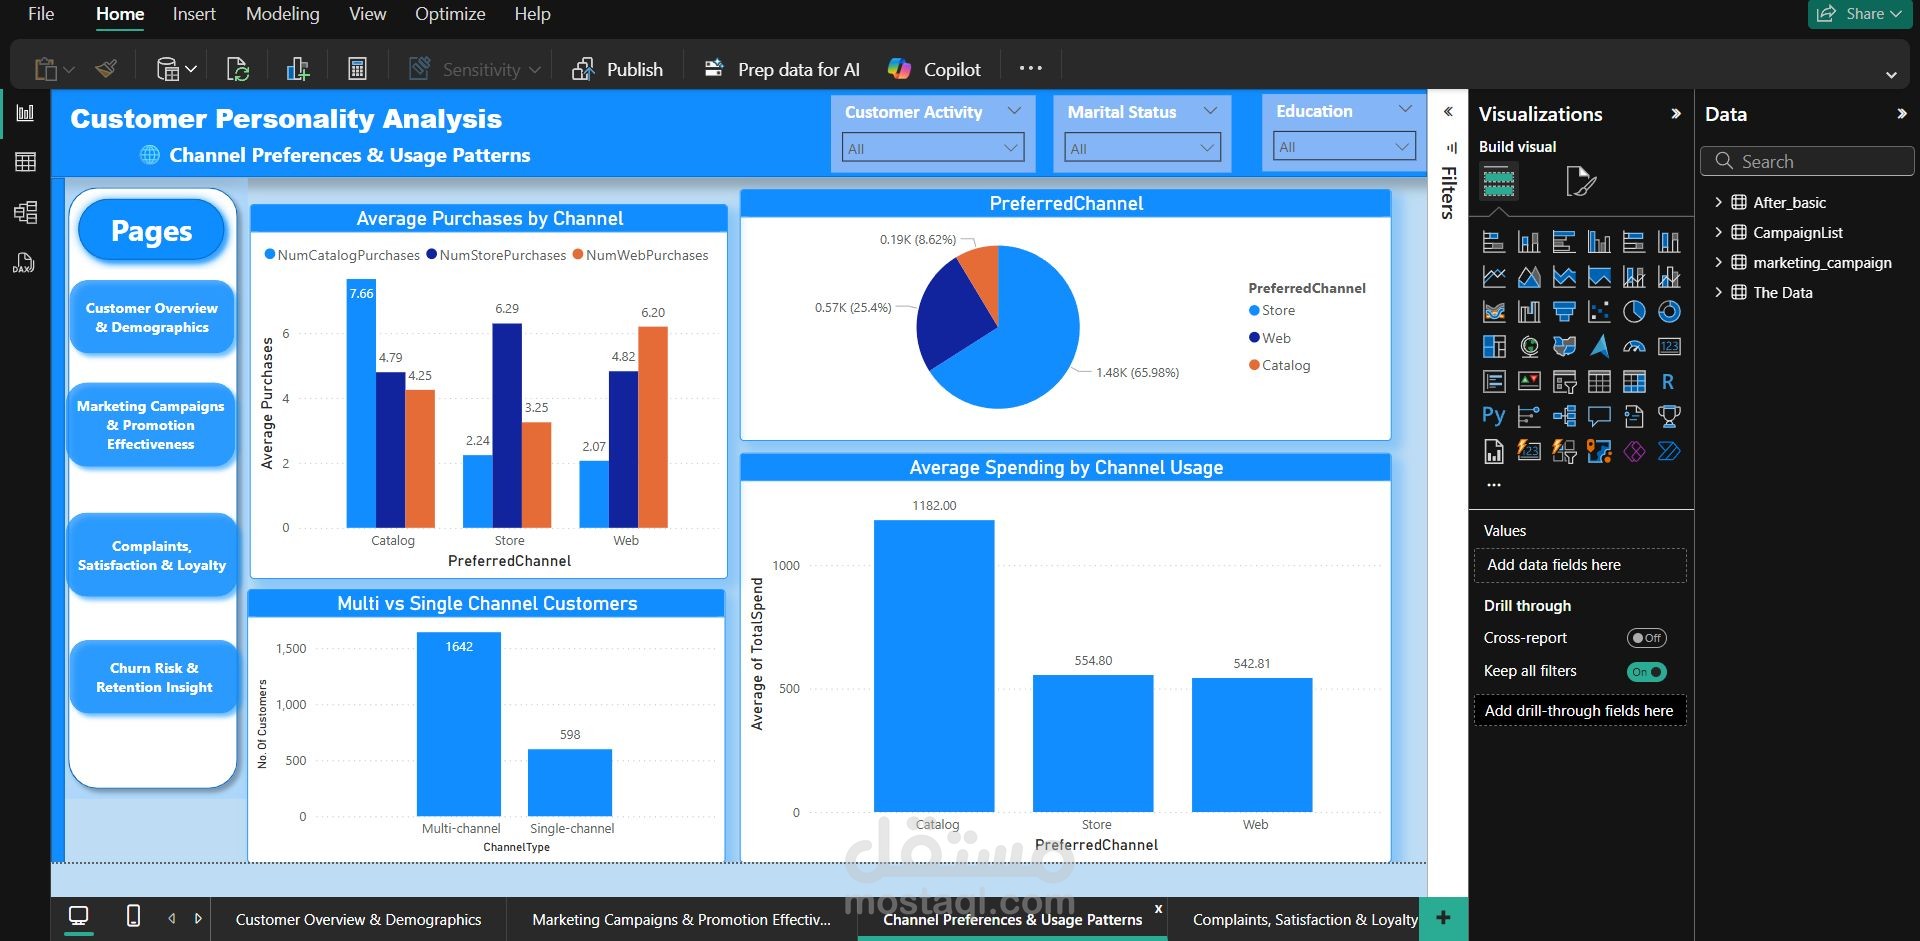
Correlation Analysis: Revealed strong relationships between income and spending (0.819), catalog purchases (0.779), and store purchases (0.675), and negative ones with number of children (-0.499) and unproductive website visits (-0.500).
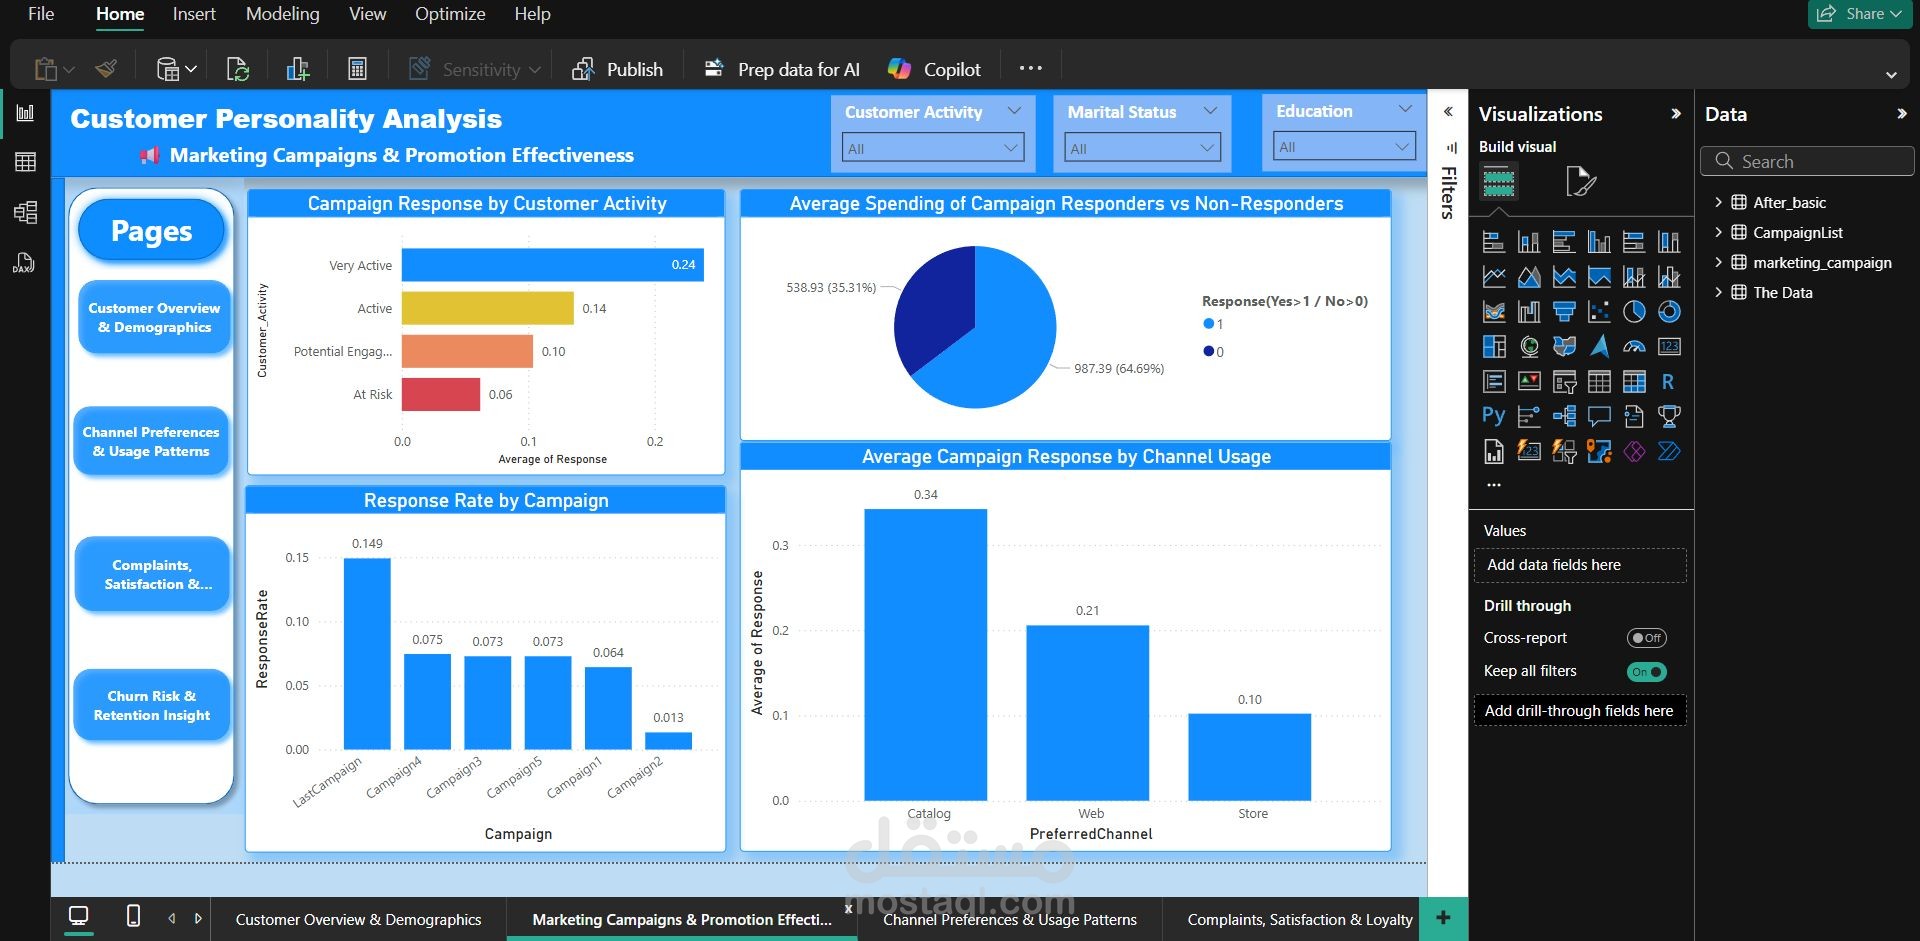
Multiple Regression: Model achieved R²=0.829, showing spending is positively affected by income (+0.013), accepted campaigns (+85.6), catalog purchases (+65.1), store purchases (+27.1), web purchases (+17.8), and negatively by number of children (-120.3).
Statistical Validation: Non-significant variables were excluded, confirming income and purchasing behavior as the strongest spending drivers.
Customer Segmentation:
Ages 31–45 showed highest responsiveness; university and PhD holders (+25%); mid-to-high income group generated 60% of total spending; frequent campaign responders exceeded 70%.
Customer Personas:
Carla the Ambitious (digital-focused), Fathy the Family Man (average income), Salem the Conservative (low activity), Lina the Elegant (high loyalty).
Results:
Phone campaigns outperformed email by 3x, ROI increased to 35%, engagement with ≥3 campaigns boosted spending by +40%, while complaints reduced responsiveness by -25%.
Recommendations:
Target high-income segments with exclusive offers, personalize messages, enhance store/catalog experience, strengthen loyalty programs, design family-oriented offers, and optimize website UX for better conversions.
Conclusion:
The project achieved 83% explanation of total spending, proving the effectiveness of combining statistical modeling with storytelling in enhancing marketing performance and maximizing ROI.